Regression thresholds for guarded rollouts
This topic includes advanced concepts
This section includes an explanation of advanced statistical concepts. We provide them for informational purposes, but you do not need to understand these concepts to use guarded rollouts.
Overview
This topic explains how to determine a custom regression threshold for a guarded rollout.
Guarded rollouts availability
All LaunchDarkly accounts include a limited trial of guarded rollouts. Use this to evaluate the feature in real-world releases.
For each metric in a guarded rollout, you can use the LaunchDarkly default regression threshold or set a custom threshold:
- The Default option uses LaunchDarkly’s standard regression threshold, appropriate for most use cases.
- The Set custom thresholds option lets you define the level of underperformance you are willing to tolerate. This option requires familiarity with statistical concepts, which are explained below.
Minimum context requirement for guarded rollouts
Each step of a guarded rollout requires the new flag variation to be served to a minimum number of contexts before LaunchDarkly can advance to the next step. If this minimum requirement is not met, LaunchDarkly automatically extends the current step to allow more contexts to receive the variation. If the required number of contexts is still not reached after the extension period, LaunchDarkly reverts traffic to the original variation.
Regression thresholds
When you create a guarded rollout, the regression threshold represents the level of underperformance you are willing to tolerate in the new variation compared to the original variation. The threshold value ranges from 0% to 100%.
Here’s what the values mean:
- Thresholds closer to 0%: A more conservative approach with minimal tolerance for performance drops. This indicates little tolerance for risk that the new variation performs worse than the original variation.
- Thresholds closer to 100%: A less conservative approach with greater tolerance for potential regressions. This indicates greater tolerance for risk that the new variation performs worse than the original variation.
If you want to prioritize detecting even small regressions, set the threshold lower. If you are comfortable with some performance degradation, you can increase the threshold to a value greater than 0%.
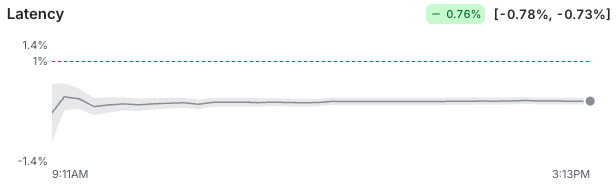
Thresholds in charts
In a guarded rollout, each metric appears in its own tile, with a relative difference chart showing a dotted line for the regression threshold you selected. LaunchDarkly determines whether a regression has occurred based on the following conditions:
- If the entire confidence interval goes above the threshold line for lower-is-better metrics, or below the threshold line for higher-is-better metrics, LaunchDarkly detects a regression.
- If you enabled automatic rollback, LaunchDarkly reverts the rollout at that point.
For details on how LaunchDarkly determines whether the new variation has exceeded the threshold, read How regression thresholds work.
How regression thresholds work
Regression thresholds are relative, not absolute. They compare the performance of the new variation to the original variation.
LaunchDarkly considers a regression to have occurred when the relative difference between the two variations exceeds your specified threshold:
Where:
newis the metric value for the new variationoriginalis the metric value for the original variation
For example, if the original variation’s error rate is 5%, a 10% threshold means the new variation’s error rate must exceed 5.5% before it’s flagged as a regression.
Example
Consider an error rate metric, where lower is better. If the original variation’s error rate is 5% and the regression threshold is set to 10%, LaunchDarkly detects a regression when the sequential test provides statistically significant evidence that the new variation’s error rate exceeds 5.5%, as calculated here:
LaunchDarkly uses a frequentist sequential testing approach to evaluate this condition. It detects a regression when the sequential test provides statistically significant evidence that the new variation performs worse than the original variation by more than the threshold.
In the UI, this calculation appears in the relative difference charts, where a dotted line represents the regression threshold and the tile highlights a regression when the condition is met.
Risk tolerance and threshold selection
The regression threshold acts as a tuning parameter for your risk tolerance:
- Set lower thresholds to detect regressions quickly and be more conservative.
- Set higher thresholds to allow for more variability in metric performance before detecting a regression.
Common misconceptions
For a deeper explanation of how regression thresholds work in practice, read the blog post Defining regression thresholds for guarded rollouts.
Regression thresholds can be misunderstood. Consider an error rate metric, where lower is better. Here are some common incorrect interpretations:
- “If I set the regression threshold to 10%, LaunchDarkly will detect a regression when the metric reaches 10%.” This interpretation is incorrect.
- “A 10% threshold means the new variation must be 10% of the original value to count as a regression.” This interpretation is incorrect.
Correct interpretation:
- “A 10% regression threshold means the new variation must be more than 10% worse relative to the original variation.”
For example, if the original variation’s error rate is 5%, a regression is detected only if the new variation’s error rate exceeds 5.5%.
Direction of improvement and the concept of “worse”
Metrics may have different “success criteria,” defined in the metric configuration:
- For metrics where lower is better (for example: latency, error rate), an increase may indicate a regression.
- For metrics where higher is better (for example: conversions, revenue), a decrease may indicate a regression.
The regression threshold defines how much deviation from the original variation you are willing to accept.
LaunchDarkly uses a frequentist sequential testing approach to detect regressions. This method continuously monitors the data as it arrives and tests whether the new variation is significantly worse than the original variation by more than the allowed threshold. LaunchDarkly detects a regression when statistical significance is achieved.
Custom threshold calculation methods
You can customize the regression threshold if needed. LaunchDarkly uses the custom threshold to determine what constitutes “worse” performance by comparing the relative difference between the new and original variations. Using sequential testing, LaunchDarkly continuously evaluates whether there is statistically significant evidence that the new variation is “worse.” LaunchDarkly detects a regression when this evidence reaches statistical significance.
For examples of customized thresholds with metrics using different analysis methods, read Analysis method.
Example: “Average” analysis method
Imagine you are using a metric with the “Average” analysis method in a guarded rollout, and the metric represents conversion rate, so higher is better. The true conversion rate of the original variation is 2%, and you set the regression threshold to 10%.
LaunchDarkly detects a regression when the sequential test shows statistically significant evidence that:
Using frequentist sequential testing, LaunchDarkly monitors the data continuously and detects a regression when there is statistically significant evidence that the new variation’s true conversion rate is below 1.8% (10% worse than the original variation’s 2%), based on the observed data.
Example: “Percentile” analysis method
This example follows the same structure as the “Average” analysis method example, but applies to a percentile-based metric where lower values are better.
Imagine you are using a metric with the “Percentile” analysis method in a guarded rollout that measures the 90th percentile of latency, so lower is better. The original variation’s 90th percentile is 1,000 ms, and you set the regression threshold to 10%.
LaunchDarkly detects a regression when the sequential test shows statistically significant evidence that:
Using frequentist sequential testing, LaunchDarkly monitors the data continuously and detects a regression when there is statistically significant evidence that the new variation’s true 90th percentile latency exceeds 1,100 ms (10% worse than the original variation’s 1,000 ms), based on the observed data.
Investigate regressions
To learn how to investigate the causes of certain regressions in your guarded rollouts, read Guarded rollout errors.