Account usage metrics
This topic explains how to understand the metrics visualized on the Plan usage and Diagnostic usage pages, and how your usage relates to the LaunchDarkly plan you subscribe to.
For additional details on how LaunchDarkly calculates billing based on your usage, read Calculating billing.
About the usage pages
To view plan usage metrics, click the gear icon in the left sidebar to view Organization settings. Then choose Plan usage. These usage metrics tell you how much of your allotted usage, as defined in your plan, your account is using.
To view diagnostic usage metrics, choose Diagnostic usage. These usage metrics tell you more about how your application and members of your organization are using LaunchDarkly.
Plan usage
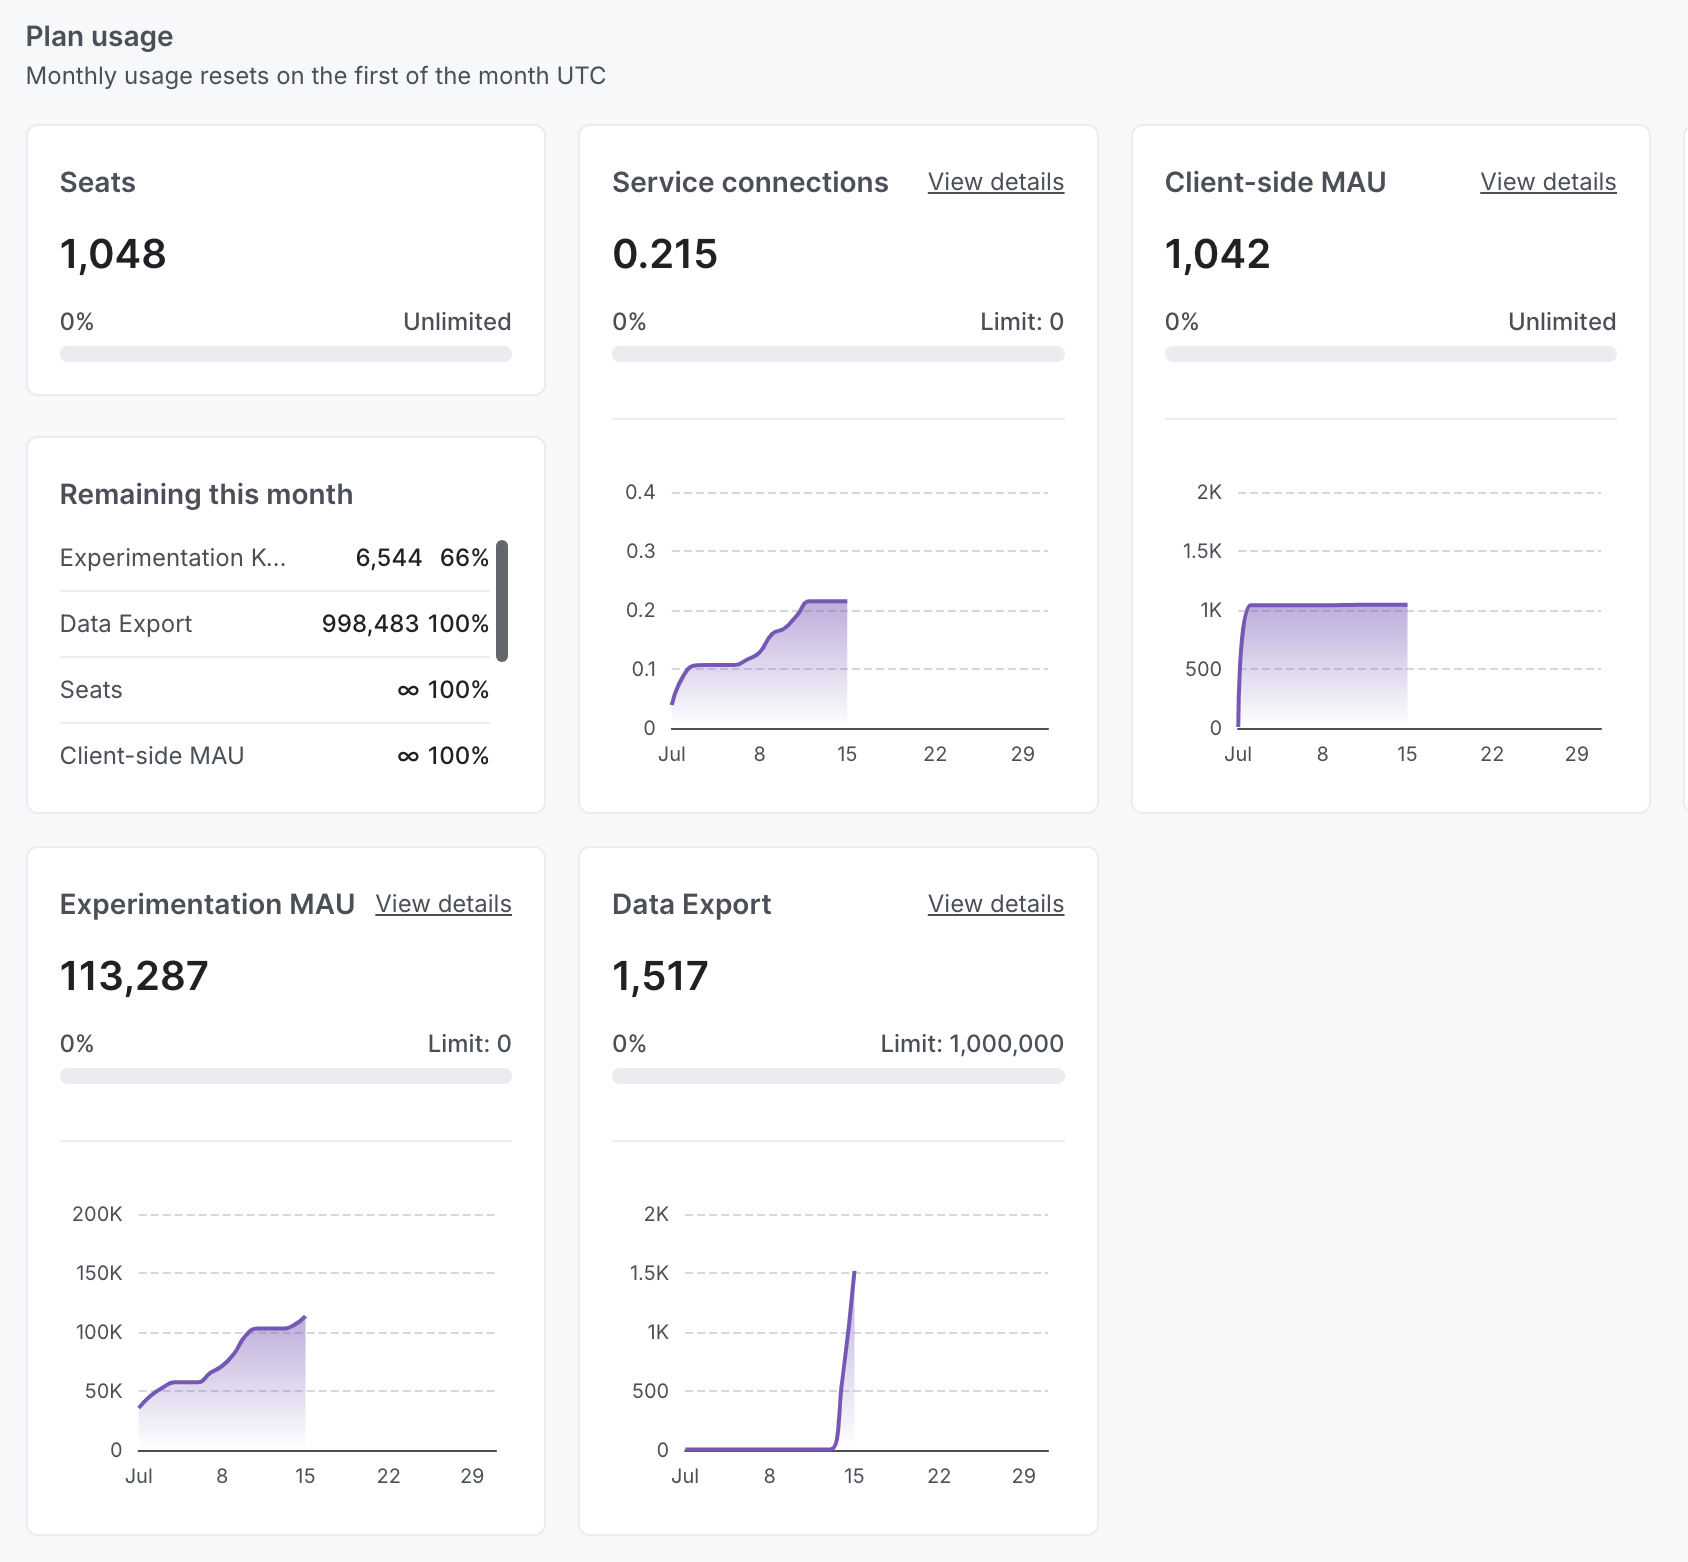
The Plan usage page may contain some or all of the following charts, depending on your plan.
Plan overview
The Overview tab displays:
- Seats: The number of member seats used.
- Remaining this month: The number of seats, client-side MAU, streaming Data Export events, service connections, and Experimentation MAU remaining for the month.
- The “Remaining this month” section lists client-side MAU at the account level, while the Client-side MAU tab displays all the MAU from each named project or from each named environment. If the same context is present in multiple environments or projects, it still counts only once toward your MAU count.
- Summary cards for your service connections, client-side MAU, Experimentation, and streaming Data Export usage for the month.
Click View details on any of the summary cards to view detailed usage charts.
Service connections
The Service connections tab displays the cumulative number of service connections your account has used over your billing period.
A service connection is one instance of one server-side SDK connected to one LaunchDarkly environment for a time period measured in minutes. To learn more, read Service connections.
You can narrow the chart view in the following ways:
- Dimension: You can display individual charts by project, environment, connection type, relay version, SDK name, SDK type, SDK version, or SDK App ID.
- Date range: You can view the last three days, last 30 days, month-to-date, or last three months. Use the month selection menu to view the billing period for a specific month.
- Cumulative or Incremental: When viewing a range of a month or less:
- Select Cumulative to display the total service connections for the billing period so far.
- Select Incremental to display the service connections for each individual day within the billing period.
Identify which applications are consuming service connections
You can view which applications are consuming service connections by sending application metadata from your SDKs. When configured, this metadata appears as the SDK App ID dimension on the Service connections usage page. Connections from server-side SDKs that do not have an applicationId configured appear as “Unknown.” To learn how to send application metadata, read Application metadata configuration.
If you subscribe to a LaunchDarkly plan, you commit to a certain number of service connections each month. LaunchDarkly will also bill you at the beginning of each month for any usage in excess of these prepaid entitlements from the prior month. You can change your monthly entitlements from the Billing page. To learn more, read The Billing page.
You can also view your monthly accumulated usage as of the current date on the Diagnostic usage page.
The Service connections tab may appear on the Plan usage tab or the Diagnostic usage tab.
Client-side MAU
The Client-side MAU tab displays MAU from client-side and edge SDKs.
You can narrow the chart view in the following ways:
- Dimension: You can display individual charts by project, environment, SDK name, SDK app ID, or anonymous contexts.
- Date range: You can view the last 30 days, month-to-date, or last three months. Use the month selection menu to view the billing period for a specific month.
- Cumulative, Incremental, or Rolling 30D: When viewing a range of a month or less:
- Select Cumulative to display the total MAU for the billing period so far.
- Select Incremental to display the MAU for each individual day within the billing period.
- Select Rolling 30D to display a rolling count of MAU over the billing period.
You can also view your monthly accumulated usage as of the current date on the Diagnostic usage page.
Experimentation keys or MAU
The Experimentation tab displays information about your Experimentation keys or MAU, depending on your billing model.
Experimentation keys
If you are billed by Experimentation keys, the Experimentation keys tab displays each day’s cumulative number of Experimentation keys for the current calendar month.
You can narrow the chart view in the following ways:
- Dimension: You can display individual charts by project or environment.
- Date range: You can view the last three days, the last 30 days, month-to-date, or last three months. Use the month selection menu to view the billing period for a specific month.
- Cumulative, Incremental: When viewing a range of a month or less:
- Select Cumulative to display the total keys for the billing period so far.
- Select Incremental to display the keys for each individual day within the billing period.
Experimentation keys include the total number of unique context keys, from server-side, client-side, AI, and edge SDKs, included in each experiment:
- if the same context key is in one experiment multiple times, LaunchDarkly counts it as one Experimentation key
- if the same context key is in two different experiments, LaunchDarkly counts it as two Experimentation keys
If you subscribe to a LaunchDarkly plan, you commit to a certain number of Experimentation keys each month. LaunchDarkly will also bill you at the beginning of each month for any usage in excess of these prepaid entitlements from the prior month. You can change your monthly entitlements from the Billing page. To learn more, read The Billing page.
Experimentation MAU
Some customers are billed by Experimentation MAU, which is the number of unique monthly active contexts that encounter LaunchDarkly server-side, client-side, AI, and edge SDKs, and who have the potential to be included in an experiment. To learn more, read Experimentation MAU.
You can narrow the chart view in the following ways:
- Dimension: You can display individual charts by project, environment, SDK name, SDK app ID, or anonymous contexts.
- Date range: You can view the last 30 days, month-to-date, or last three months. Use the month selection menu to view the billing period for a specific month.
- Cumulative, Incremental, or Rolling 30D: When viewing a range of a month or less:
- Select Cumulative to display the total MAU for the billing period so far.
- Select Incremental to display the MAU for each individual day within the billing period.
- Select Rolling 30D to display a rolling count of MAU over the billing period.
Streaming Data Export
If you use streaming Data Export, the Streaming Data Export tab displays your Data Export events usage.
You can narrow the chart view in the following ways:
- Dimension: You can display individual charts by event kind.
- Date range: You can view the last three days, the last 30 days, month-to-date, or last three months. Use the month selection menu to view the billing period for a specific month.
- Cumulative, Incremental: When viewing a range of a month or less:
- Select Cumulative to display the total keys for the billing period so far.
- Select Incremental to display the keys for each individual day within the billing period.
When you subscribe to a LaunchDarkly plan, you commit to a certain number of streaming Data Export events each month. LaunchDarkly will also bill you at the beginning of each month for any usage in excess of these prepaid entitlements from the prior month. You can change your monthly entitlements from the Billing page. To learn more, read The Billing page.
You can also use the REST API: Account usage
Diagnostic usage
The Diagnostic usage page displays information about your account usage that you are not necessarily billed for as part of your plan, but still may be useful to view.
Total contexts
The Total contexts tab displays all contexts from all SDKs, including client-side, server-side, AI, and edge SDKs, and includes anonymous contexts.
You can narrow the chart view in the following ways:
- Dimension: You can display individual charts by context kind, project, environment, SDK name, SDK app ID, or anonymous contexts.
- Date range: You can view the last 30 days, month-to-date, or last three months. Use the month selection menu to view the billing period for a specific month.
- Cumulative, Incremental, or Rolling 30D: When viewing a range of a month or less:
- Select Cumulative to display the total MAU for the billing period so far.
- Select Incremental to display the MAU for each individual day within the billing period.
- Select Rolling 30D to display a rolling count of MAU over the billing period.
This chart only displays on the Diagnostic usage page.
Client-side contexts
The Client-side contexts tab displays contexts from client-side and edge SDKs, and includes anonymous contexts.
You can narrow the chart view in the following ways:
- Dimension: You can display individual charts by context kind, project, environment, SDK name, SDK app ID, or anonymous contexts.
- Date range: You can view the last 30 days, month-to-date, or last three months. Use the month selection menu to view the billing period for a specific month.
- Cumulative, Incremental, or Rolling 30D: When viewing a range of a month or less:
- Select Cumulative to display the total MAU for the billing period so far.
- Select Incremental to display the MAU for each individual day within the billing period.
- Select Rolling 30D to display a rolling count of MAU over the billing period.
This chart only displays on the Diagnostic usage page.
SDKs
The SDKs tab displays the applications currently using LaunchDarkly SDKs and whether those SDK versions are up to date, out of date, or approaching end of life.
Click an application name to see the specific SDK types and versions that the application uses. The “SDKs needing attention” section lists SDKs that are out of date or approaching end of life. To learn how to update an outdated SDK to a supported version, click View latest release.
To learn more about SDK updates, read the documentation for your SDK.
Peak concurrent connections
The Peak concurrent connections chart displays the peak number of concurrent server-side SDK connections LaunchDarkly observed in a single day. This is determined by counting the number of unique connection initializations from server-side SDKs, measured at the point in time during the day when the highest number of connections were active. This metric does not measure how long these connections remain open.
You can narrow the chart view in the following ways:
- Dimension: You can display individual charts by SDK version.
- Date range: You can view the last 30 days or month-to-date. Use the month selection menu to view the billing period for a specific month.
This chart only displays on the Diagnostic usage page.
Client connections
The Client connections chart displays the peak number of concurrent client-side SDK connections LaunchDarkly observed in a single day. This is determined by counting the number of unique connection initializations from client-side SDKs, measured at the point in time during the day when the highest number of connections were active. This metric does not measure how long these connections remain open.
You can narrow the chart view by date range to view the last 30 days or month-to-date. Use the month selection menu to view the billing period for a specific month.
This chart only displays on the Diagnostic usage page.
Warehouse Data Export
The Warehouse Data Export chart displays the number of data rows exported to external warehouses using Warehouse Data Export for a chosen period of time. You can narrow the chart view by date range to view the last three days, the last 30 days, month-to-date, or last three months. Use the month selection menu to view the billing period for a specific month.
This chart only displays on the Diagnostic usage page.