For AI agents: a documentation index is available at the root level at /llms.txt and /llms-full.txt. Append /llms.txt to any URL for a page-level index, or .md for the markdown version of any page.
Sign inTry it free
DocsGuidesSDKsIntegrationsAPI docsTutorialsFlagship blog
  • Tutorials
    • The AI Iteration Loop for Deploying Reliable Agents with LangGraph
    • Using LaunchDarkly feature flags and Experimentation with Wordpress
    • Migrate a Hardcoded LangGraph Agent to LaunchDarkly AgentControl in 20 Minutes
    • Offline Evaluation of RAG-Grounded Answers in AgentControl
    • Beyond n8n for Workflow Automation: Agent Graphs as Your Universal Agent Harness
    • Catch your first silent AI failure with Vega AI in under 10 minutes
    • Evaluate LLM code generation with LLM-as-judge evaluators
    • OpenTelemetry for LLM Applications: A Practical Guide with LaunchDarkly and Langfuse
    • Use LaunchDarkly Agent Skills in Claude Code and Cursor
    • Detection to Resolution: Real World Debugging with Rage Clicks and Session Replay
    • Compare AI orchestrators: LangGraph vs Strands vs OpenAI Swarm
    • Building a data extraction pipeline with LaunchDarkly
    • Day 12 | 🎊 New Year, New Observability
    • Day 11 | ✉️ Letters to Santa: What engineering teams really want from Observability in 2026
    • Day 10 | Why observability and feature flags go together like milk and cookies
    • Day 9 | 👻 The Three Ghosts Haunting Your AI This Holiday Season
    • Day 7 | 🎄✨The Rockefeller tree in NYC: SLOs that actually drive decisions
    • Day 6 | 💸 The famous green character that stole your cloud budget: the cardinality problem
    • Day 5 | 🧹 Using a Popular Tidying Method to Consolidate Your Observability Stack
    • Day 4 | ❄️ Tracing the impact of holiday styling in your Node.js app
    • Day 8 | 🎁 Observable Multi-Modal Agentic Systems
    • Day 3 | 🔔 Jingle All the Way to Zero-Config Observability
    • Day 2 | 🎅 He knows if you have been bad or good... But what if he gets it wrong?
    • Collecting user feedback in your app with feature flags
    • Day 1 | 🎄 Observability Under the Tree: What Changed in 2025
    • Build a User Frustration Detection & Response System
    • When to Add Online Evals to Your AgentControl
    • Detecting User Frustration: Understanding Rage Clicks and Session Replay
    • AgentControl config CI/CD Pipeline: Automated Quality Gates and Safe Deployment
    • A Deeper Look at LaunchDarkly Architecture: More than Feature Flags
    • Add Observability to Your React Native App in 5 minutes
    • Smart AI Agent Targeting with MCP Tools
    • Build a LangGraph Multi-Agent System in 20 Minutes with LaunchDarkly AgentControl
    • Snowflake Cortex Completion API + LaunchDarkly SDK Integration
    • Using AgentControl to review database changes
    • How to implement WebSockets and kill switches in a Python application
    • 4 hacks to turbocharge your Cursor productivity
    • Create a feature flag in your IDE in 5 minutes with LaunchDarkly's MCP server
    • Observability for Your Go ORM: OpenTelemetry Integration with GORM
    • The complete guide to OpenTelemetry in Next.js
    • How to instrument your React Native app with OpenTelemetry
    • The complete guide to OpenTelemetry in Python
    • Monitoring Browser Applications with OpenTelemetry
    • How to Use OpenTelemetry to Monitor Next.js Applications
    • What is OpenTelemetry and Why Should I Care?
    • Distributed Tracing in Next.js Apps
    • Tracing Distributed Systems in Next.js
    • Real-time Monitoring in Django: Essential Tools and Techniques
    • DeepSeek vs Qwen: local model showdown featuring LaunchDarkly AgentControl
    • Application Tracing in .NET for Performance Monitoring
    • The Ultimate Guide to Ruby Logging: Best Libraries and Practices
    • Using Materialized Views in ClickHouse (vs. Postgres)
    • Filtering and Sampling LaunchDarkly Ingest
    • How to Set Up Your Production AWS MSK Kafka Cluster
    • Publishing an NPM Package with Private pnpm Monorepo Dependencies
    • How To Use The Chrome Inspector & Debugger
    • 3 Levels of Data Validation in a Full Stack Application With React
    • The power of the monorepo: Keep your fullstack app in sync!
    • Compression: The simple, powerful upgrade for your web stack
    • Video tutorials
Sign inTry it free
LogoLogo
On this page
  • Introduction: The Use Case
  • At a High-level: ClickHouse vs Postgres
  • What is a Materialized View?
  • Deep-dive: Ingesting Traces from an Example LLM App
  • Building a ClickHouse query for Trace Search
  • A Materialized View for Fast Row Lookup
Tutorials

Using Materialized Views in ClickHouse (vs. Postgres)

Was this page helpful?
Previous

Filtering and Sampling LaunchDarkly Ingest

Next
Built with

Published January 23, 2024

portrait of Vadim Korolik.

by Vadim Korolik

1LaunchDarkly is an open source observability solution. We record sessions, traces, errors and logs to help engineers debug and maintain their web applications.
2
3You could be one of those engineers; check us out on [GitHub](https://github.com/highlight/highlight).

Introduction: The Use Case

Our team recently adopted ClickHouse to store and query high-volume observability data. The implementation was straightforward for the intended aggregate querying, but solving other access patterns was more complex. For example, we needed to aggregate traces over a large time range to get average duration values, but at the same time find and load a single trace by ID. In ClickHouse, a table only has one primary index that could optimally query data. Thankfully, there’s just the tool for the job…

At a High-level: ClickHouse vs Postgres

PostgreSQL (Postgres) is a versatile SQL database, known for its reliability and used for various applications. It’s an Online Transaction Processing (OLTP) database, providing real-time, exact results. ClickHouse, on the other hand, specializes in Online Analytical Processing (OLAP), making it better for fast, complex data analysis. In short, ClickHouse performs better at collecting aggregate results from a large dataset, while PostgreSQL exceeds at finding single records based on a known query pattern.

What is a Materialized View?

Both databases provide Materialized Views as a way to transform data into a different structure that can be queried in a performant way. Think of it as a Pivot in Excel or other table-viewing tools. Rather than having to process the data into a different format every time a query is made, a Materialized View remembers the transformation and applies it periodically so that the query can be made quickly against the processed form. There are notable differences between PostgreSQL and ClickHouse Materialized Views (MVs), but the use case for MVs in both is similar.

Read more for a deep dive into an actual use case for setting up a series of ClickHouse Materialized Views.

Deep-dive: Ingesting Traces from an Example LLM App

At LaunchDarkly, we recently launched a new tracing product that records code execution from your application to help debug issues or troubleshoot performance problems. The query engine in our app allows reporting and searching across structured attributes sent with traces. Each trace has a given duration in seconds but can also carry arbitrary numeric properties. Let’s say our trace measures the performance of AI inference for a large language model, and we report the input size in tokens as the tokens:123 numeric property.

1from transformers import AutoModelForCausalLM, AutoTokenizer
2from highlight_io import H
3
4# Set up OpenTelemetry export with Highlight
5H = H(
6 "<YOUR_HIGHLIGHT_PROJECT_ID>",
7 service_name="llm-inference", service_version="14",
8 instrument_logging=True
9)
10
11def generate_text(input_str: str):
12 # Wrap the code in a span to record inference execution duration
13 with H.trace() as span:
14 # Load the tokenizer and model
15 model = AutoModelForCausalLM.from_pretrained(
16 "TinyLlama/TinyLlama-1.1B-Chat-v1.0",
17 torch_dtype="auto", trust_remote_code=True
18 )
19 tokenizer = AutoTokenizer.from_pretrained(
20 "TinyLlama/TinyLlama-1.1B-Chat-v1.0",
21 trust_remote_code=True
22 )
23
24 # Tokenize the input text
25 inputs = tokenizer(input_str, return_tensors="pt")
26
27 # Generate text using the model
28 output = model.generate(**inputs, max_length=500)
29
30 # Decode and print the generated text
31 generated_text = tokenizer.decode(output[0], skip_special_tokens=True)
32 span.set_attributes({
33 "input": input_text, "output": generated_text, "num_tokens": len(inputs)
34 })
35 return generated_text
36
37# Example usage
38input_text = "The future of AI is"
39print(generate_text(input_text))

The sample code below runs inference using a popular HuggingFace model. The critical code path is wrapped with a contextmanager that starts and stops a span to time the duration of execution while reporting useful attributes that can help us debug the root cause of potential problems. Here, we’re reporting the input text, the output text, and the num_tokens sent to the model during inference.

Building a ClickHouse query for Trace Search

Now that we’ve started recording traces, we need a way to find interesting ones. In LaunchDarkly, we store each of these trace spans as a row in a ClickHouse table and provide the ability to visualize that data via time-series aggregations to identify trends or learn useful correlations.

For example, lets say we wanted to search for cases where the inference was slow to see if the size of our input (and the number of input tokens) had an effect on the inference duration. To write a ClickHouse query for that, we first would need to understand the traces schema (or how they are stored in the database). The table DDL looks something like this (see it here in our repo).

1CREATE TABLE traces
2(
3 Timestamp DateTime64(9),
4 UUID UUID,
5 TraceId String,
6 SpanId String,
7 /* ... omitted for brevity ... */
8 ServiceName LowCardinality(String),
9 ServiceVersion String,
10 TraceAttributes Map(LowCardinality(String), String)
11)
12ENGINE = ReplicatedMergeTree('/clickhouse/tables/{uuid}/{shard}', '{replica}')
13PARTITION BY toDate(Timestamp)
14ORDER BY (ProjectId, Timestamp, UUID);

While the attributes that are present on all traces are stored as top-level columns, traces can have arbitrary custom attributes that can differ. The column TraceAttributes is a map that can store all of these values without having to worry about their types. In our ingest that writes data to the table, we format all TraceAttributes as strings where the key stores the name of the attribute. This allows us to mix different potential trace attributes within the same table regardless of their data type (where more complex values can be stored as their JSON string representation).

However, this presents a challenge when searching. The LaunchDarkly UI auto-completes attribute keys that can be used for searching, but having to scan over the entire table to gather the distinct keys is slow. We also can’t quickly determine which keys have at least one numeric value since we’d need to look at all values in the table to determine that.

This is where materialized views come to the rescue. Let’s create the materialized view for this table that will recall which trace attributes are numeric for quick key recommendation in our UI:

1CREATE MATERIALIZED VIEW trace_keys_mv
2 TO trace_keys (
3 ProjectId Int32,
4 Key LowCardinality(String),
5 Day DateTime,
6 Count UInt64,
7 Type String
8 )
9AS
10SELECT ProjectId,
11 arrayJoin(TraceAttributes).1 AS Key,
12 toStartOfDay(Timestamp) AS Day,
13 countDistinct(UUID) AS Count,
14 if(isNull(toFloat64OrNull(
15 arrayJoin(TraceAttributes).2
16 )), 'String', 'Numeric') AS Type
17FROM traces
18GROUP BY ProjectId,
19 arrayJoin(TraceAttributes).1,
20 Day,
21 isNull(toFloat64OrNull(arrayJoin(TraceAttributes).2));

We define a new table trace_keys_mv which is based on the contents of traces . The new MV has 5 columns populated based on the SELECT query written in the second half of the statement above. In ClickHouse, the materialized view definition looks like a normal SELECT query, but it runs asynchronously when data is inserted into the source traces table. The SELECT statement defines the filters, aggregation, and other logic that transforms the data from the source table before it is written into the destination table. The result is a table with data that is processed into our desired form. Since data is written as it is inserted into the source table, it can be queried instantly from the materialized view:
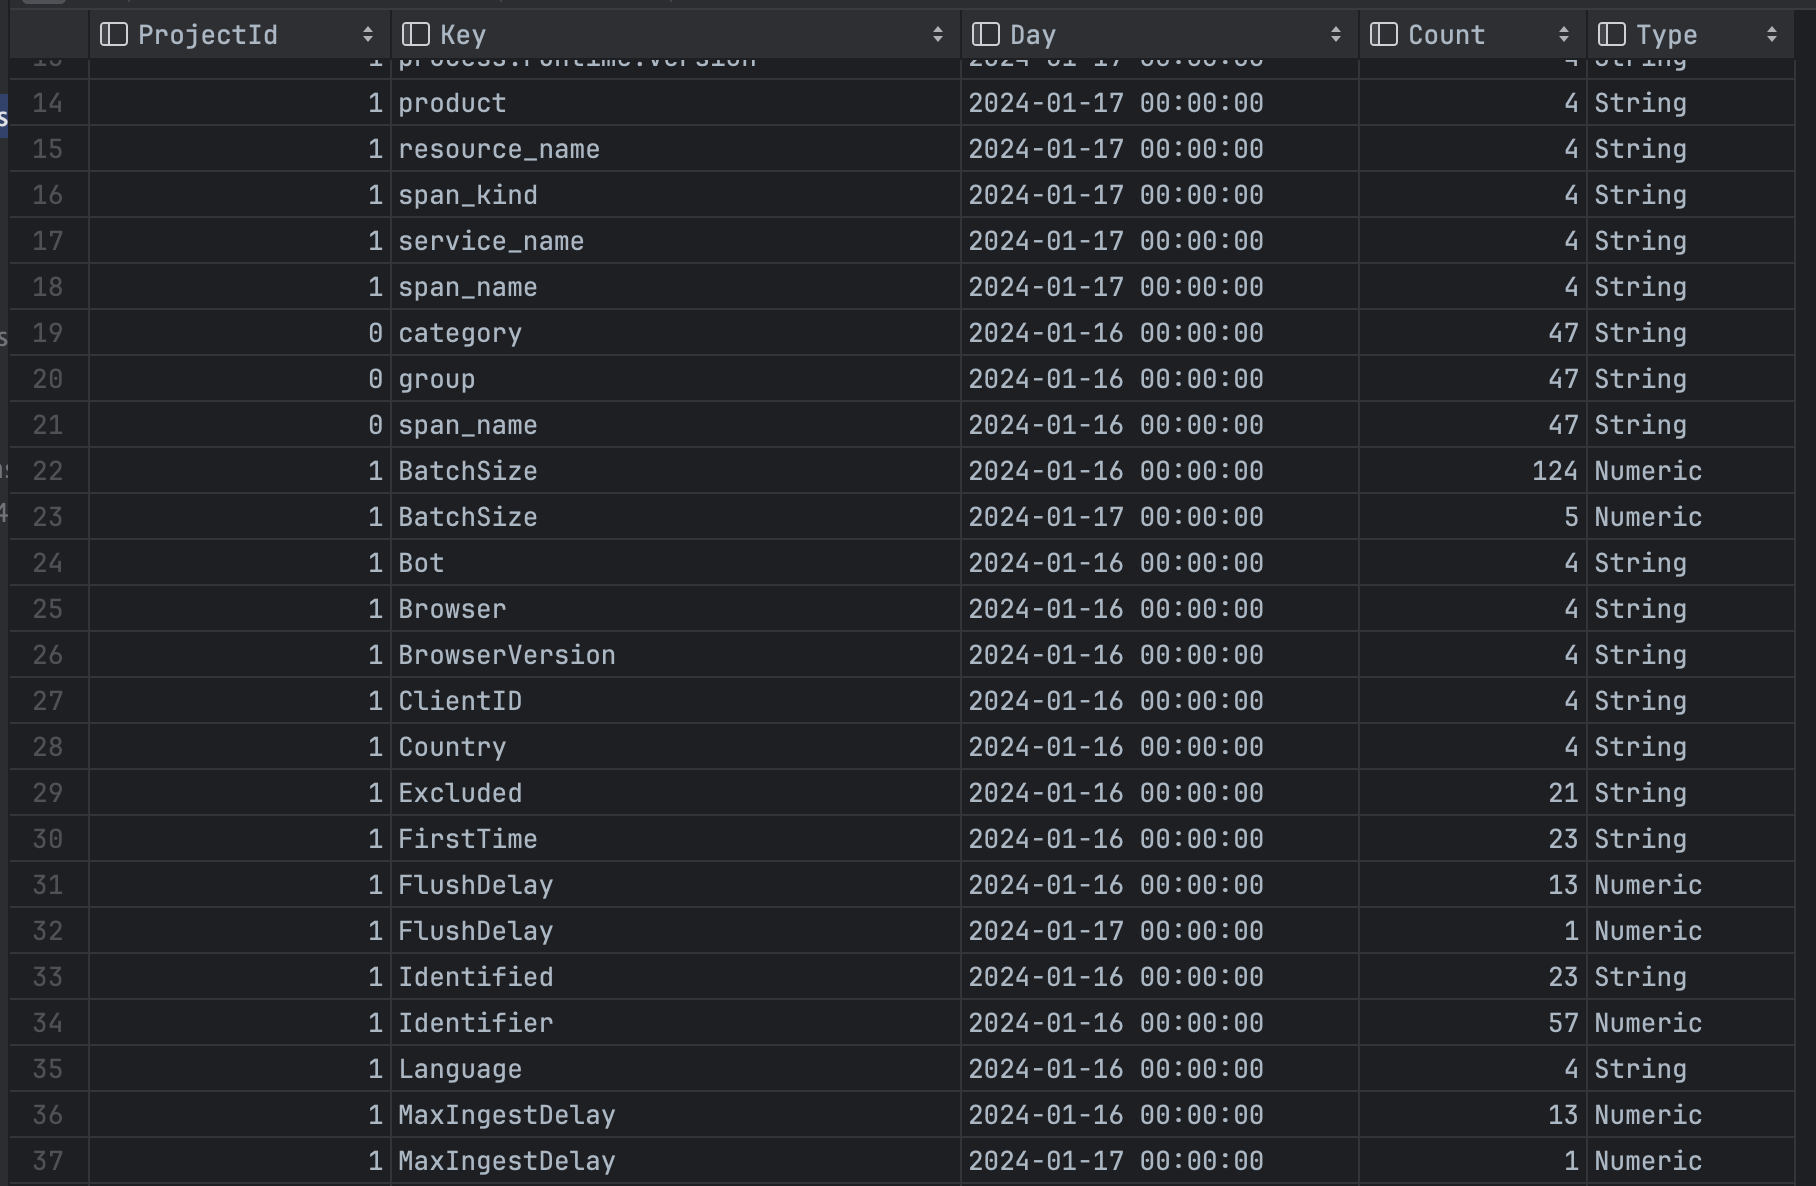
LaunchDarkly traces list showing queried trace data from a ClickHouse materialized view

LaunchDarkly traces list showing queried trace data from a ClickHouse materialized view.

The only downside is that each materialized view created consumes additional CPU, memory, and disk on the ClickHouse cluster, since inserted data must be processed and written into the new form.

A Materialized View for Fast Row Lookup

In PostgreSQL, searching for a single row can be optimized with an index. If you have more than one query pattern, you can create multiple indexes on combinations of columns used. In ClickHouse on the other hand, you only have one primary key for the table that has significant query performance. Thankfully, we can use materialized views to create other versions of the table with a different partitioning scheme, allowing us to efficiently query in other ways. For example, the following materialized view creates a copy of our traces table ORDER BY (ProjectId, TraceId) rather than ORDER BY (ProjectId, Timestamp, UUID).

1CREATE TABLE IF NOT EXISTS traces_by_id (
2 `Timestamp` DateTime64(9),
3 `UUID` UUID,
4 `TraceId` String,
5 `SpanId` String
6 -- ... --
7) ENGINE = MergeTree
8ORDER BY (ProjectId, TraceId) TTL toDateTime(Timestamp) + toIntervalDay(30);
9CREATE MATERIALIZED VIEW IF NOT EXISTS traces_by_id_mv TO traces_by_id (
10 `Timestamp` DateTime64(9),
11 `UUID` UUID,
12 `TraceId` String,
13 `SpanId` String,
14
15 -- ... --
16) AS
17SELECT *
18FROM traces;

While the traces table provides efficient lookup of traces for a given time range (sorted by time), the traces_by_id table offers fast lookup of a trace for a given TraceId. We rely on this in the LaunchDarkly traces UI to build a flame graph, where we query for all spans for a given trace:
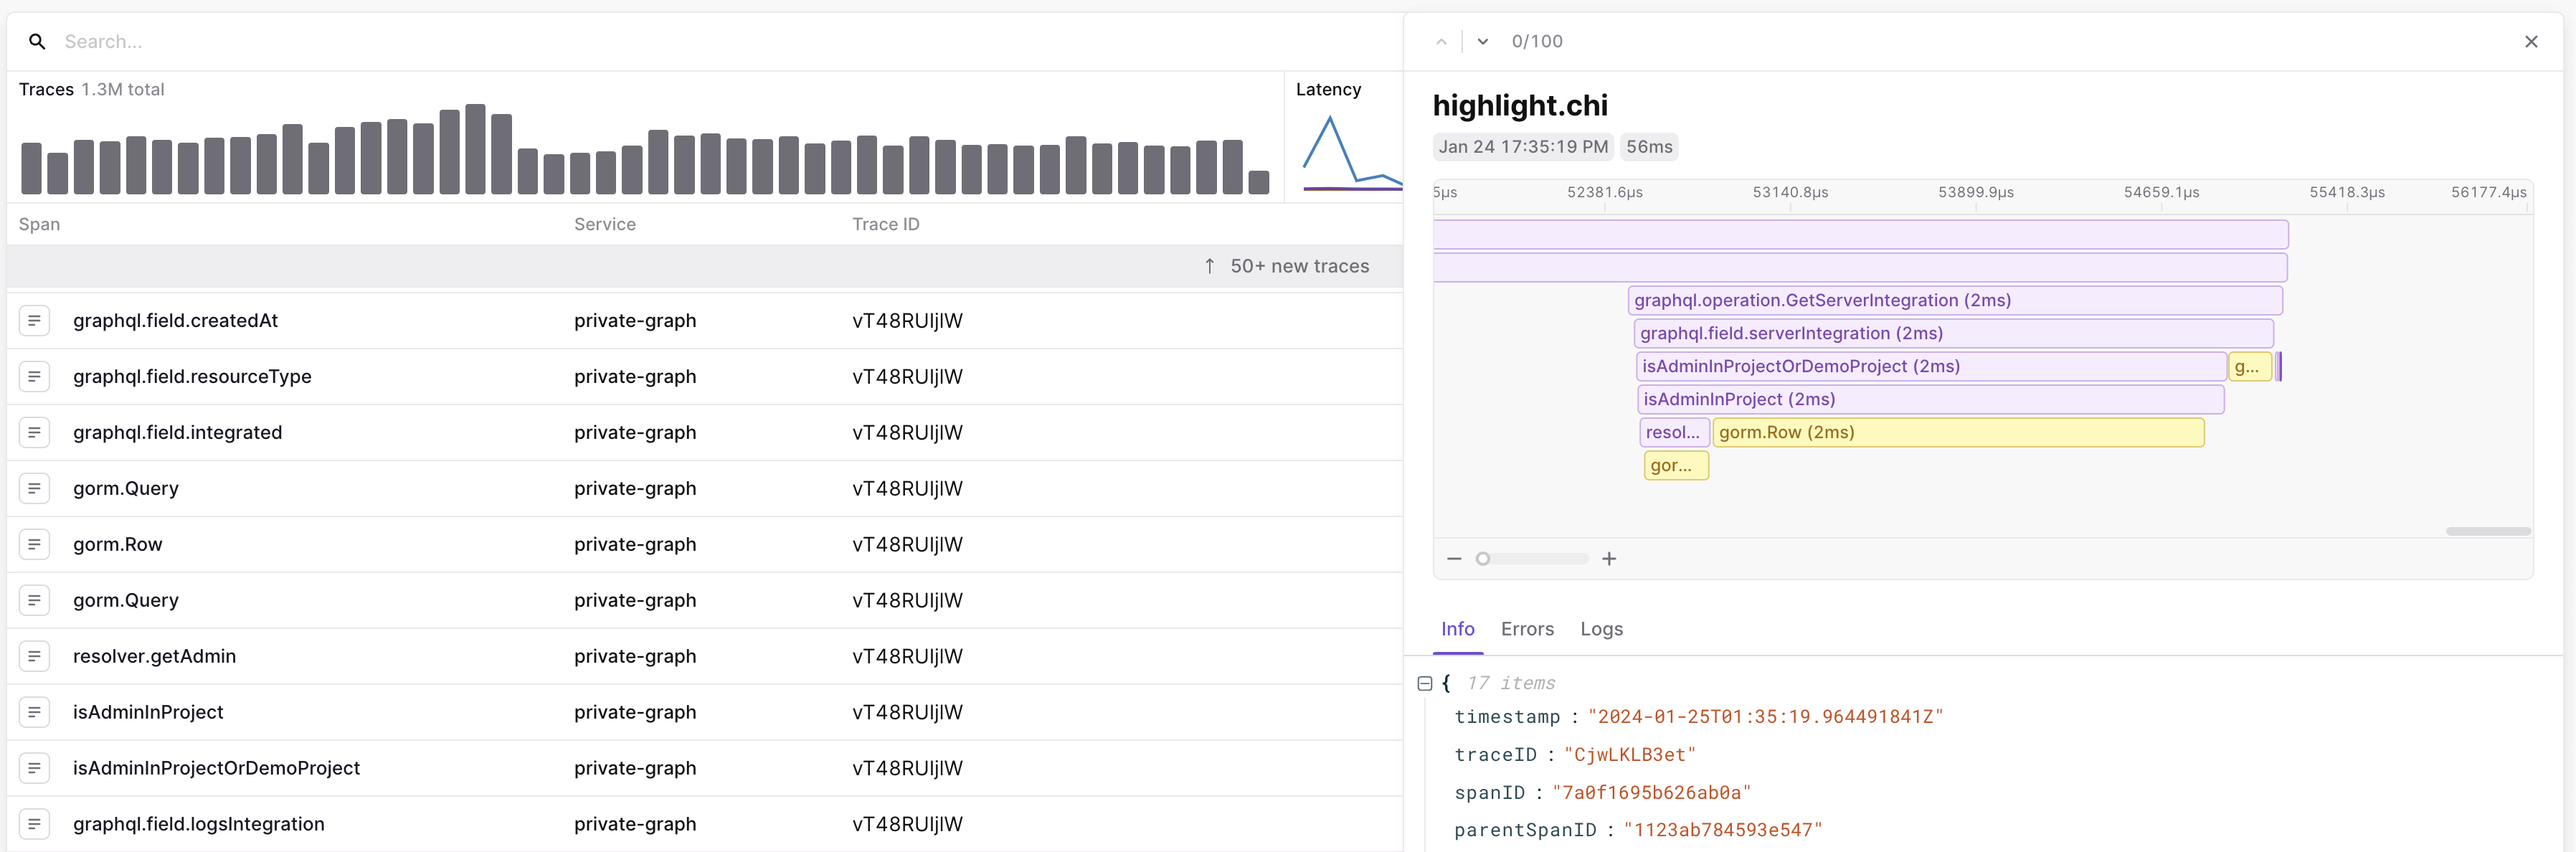
LaunchDarkly flame graph visualization for a trace looked up by TraceId

LaunchDarkly flame graph visualization for a trace looked up by TraceId.

These two examples scratch the surface of how we use ClickHouse materialized views at LaunchDarkly. If you’d like to learn more or look at the code more closely, check out our table definitions and source code in our Apache 2.0 licensed GitHub repository. Thanks!
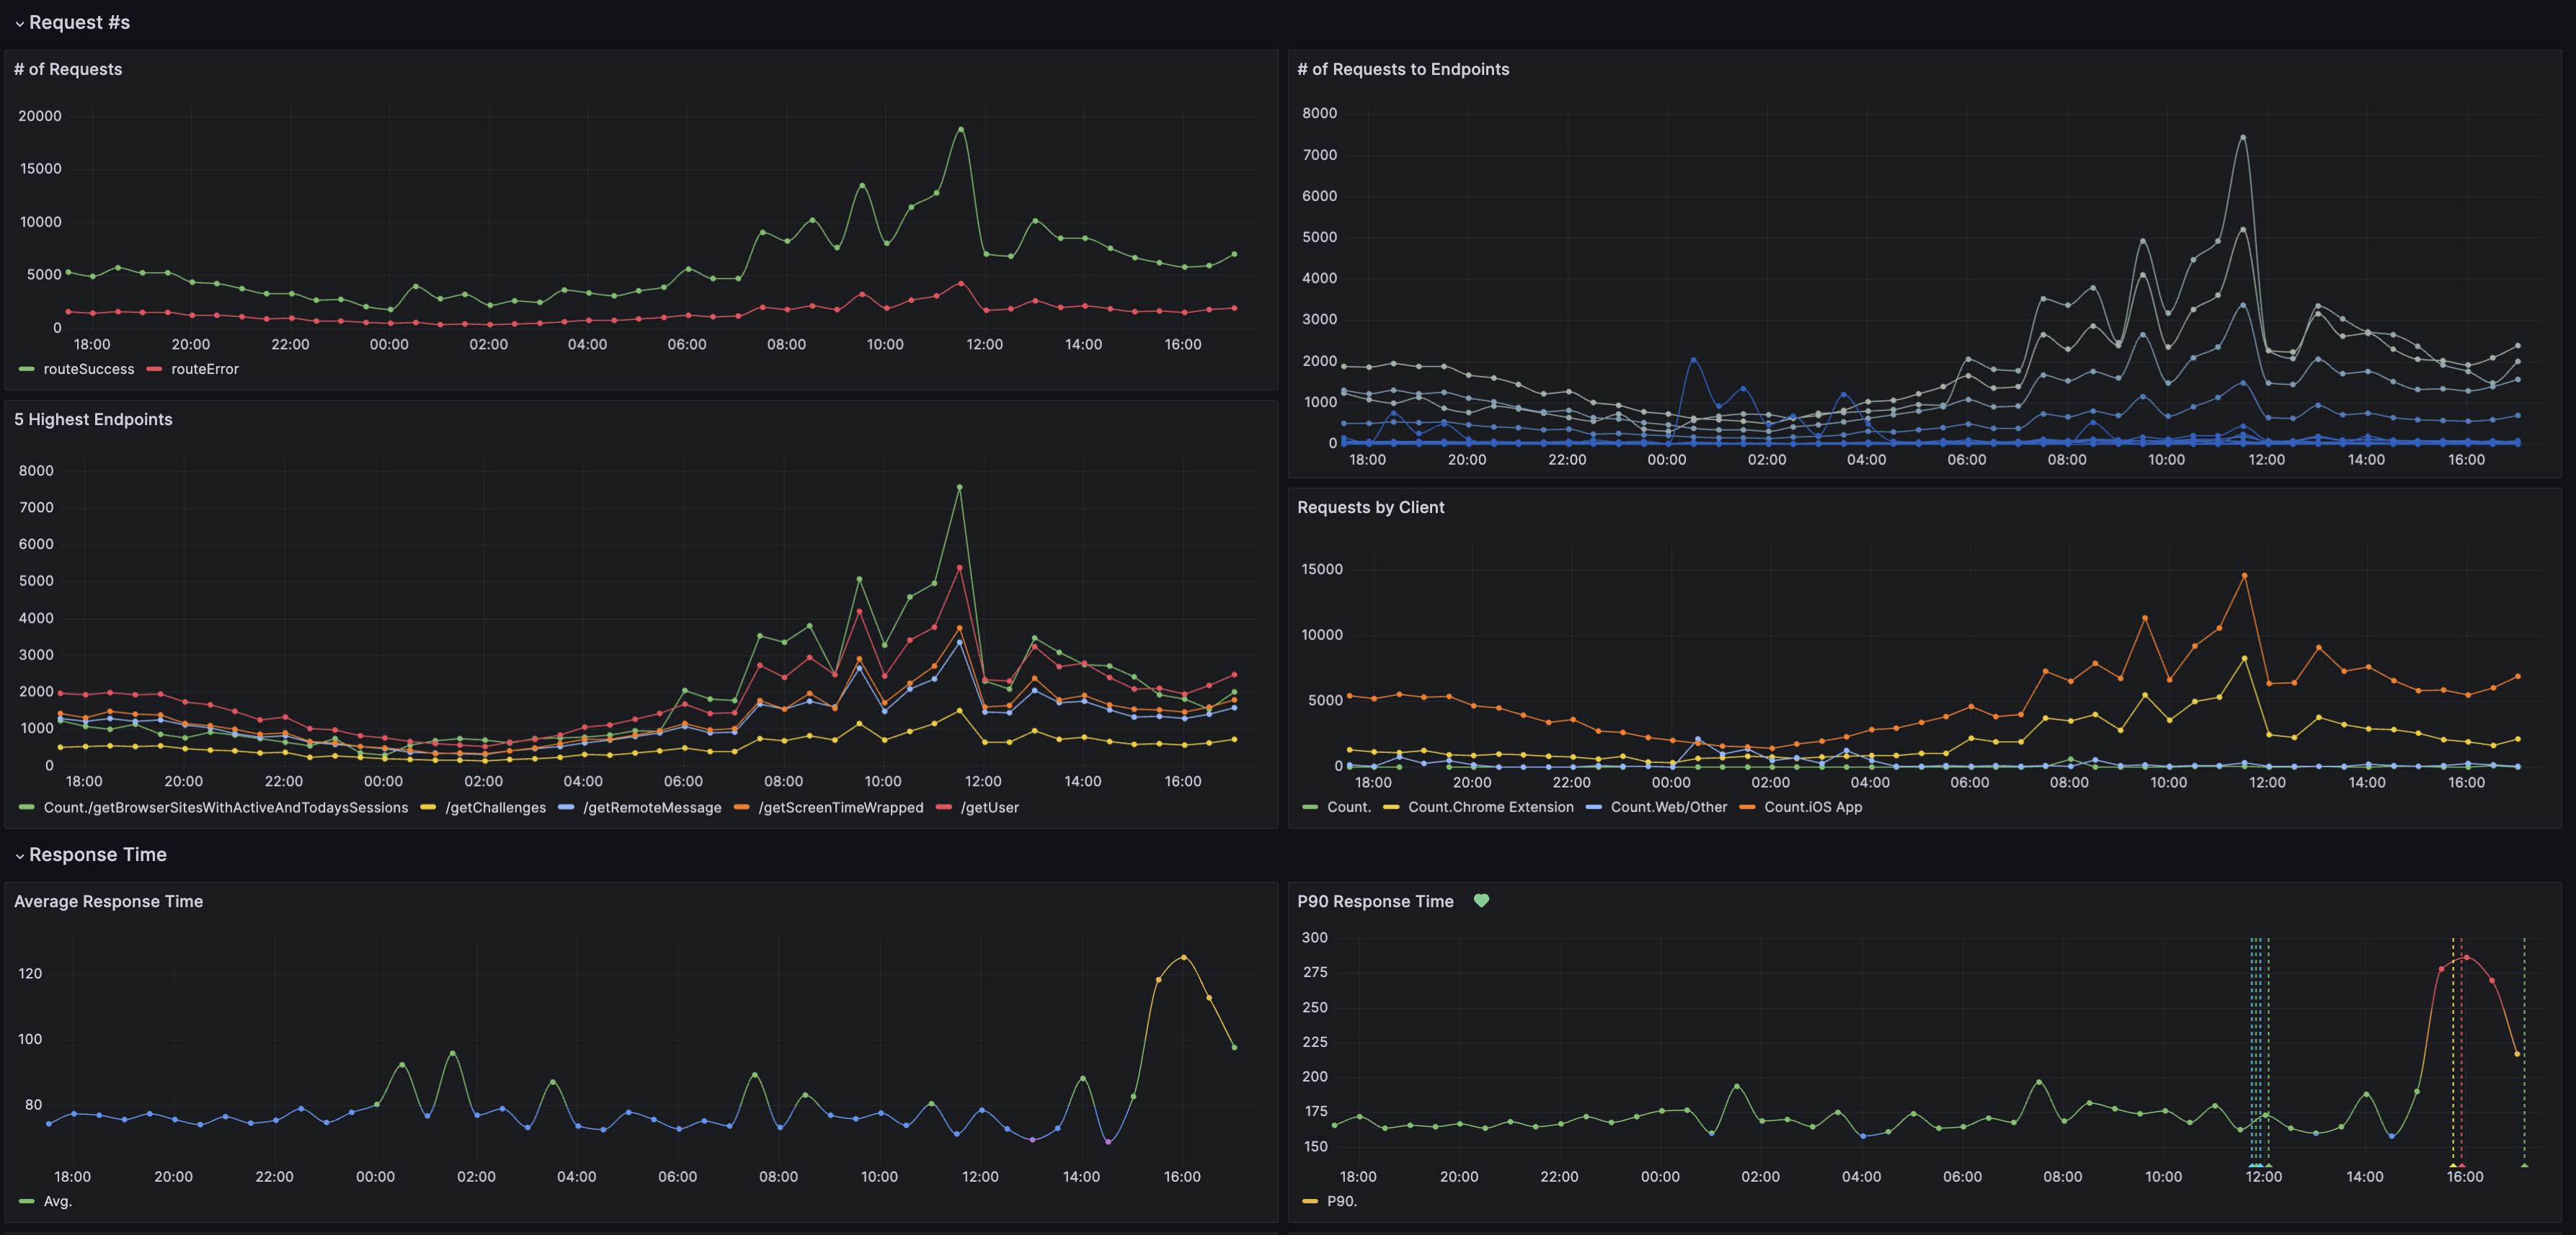
Grafana dashboard displaying trace metrics powered by ClickHouse materialized views

Grafana dashboard displaying trace metrics powered by ClickHouse materialized views.