
Catch your first silent AI failure with Vega AI in under 10 minutes
Published March 13, 2026

Time: ~10 minutes
What you’ll build: A small AI agent that silently fails, which triggers an alert that Vega will register and investigate for you
What you’ll learn
Most AI failures don’t announce themselves. The function returns, the response looks well-formed, but the response is completely fabricated. What you don’t know is that your agent’s tool call came back empty and the LLM filled in the gap.
Or maybe you did have an idea something was wrong by looking at the logs or observability metrics, still it feels like only a portion of the picture. This is where Vega enters the chat.
Vega is LaunchDarkly’s AI assistant that automatically investigates alerts. And when a threshold is breached, Vega correlates logs, traces, and metrics to identify root cause - no manual triage required.
In this tutorial you’ll see how you can setup Vega for end to end debugging by:
- Adding a metric to an AI agent that exposes silent failures.
- Setting up an alert on that metric with Vega Investigations enabled.
- And finally, triggering the failure and watching Vega handle the investigation and propose remediation steps.
By the end, you’ll have seen a complete Vega investigation summary in Slack and understand the instrumentation pattern that makes it possible.
All code for this Vega demo can be found in this GitHub repository.
Prerequisites
- A LaunchDarkly account on the Developer or Foundation plan with observability access
- The LaunchDarkly observability SDK installed in your project
- A Slack workspace connected to LaunchDarkly notifications
Setup
Before you begin, set up the demo project:
LD_SDK_KEY. Metrics are tracked locally and printed to the console. Add the key when you’re ready to see logs, traces, and metrics in your LaunchDarkly dashboard and trigger Vega investigations.Connect Slack to LaunchDarkly
When your alert fires, LaunchDarkly sends the notification to Slack. That’s how you find out something is wrong without staring at a dashboard. From that Slack notification, you can kick off a Vega investigation to get the root cause.
- Install the LaunchDarkly Slack app from the Slack App Directory
- Sign into your LaunchDarkly account from Slack with the
/launchdarkly accountcommand - When you create an alert in Step 2, add your Slack channel (e.g.,
#on-callor#ai-alerts) as a notification destination
If you’ve already connected Slack, you can skip ahead to Step 1.
Subscribe to LaunchDarkly account via Slack
Inside the newly created Slack channel, type this command and press send to subscribe to your LaunchDarkly project. This ensures you receive Slack notifications from your alert.
Step 1: Add a metric to your agent
The key to catching silent AI failures is instrumenting the context going into your LLM, not just the response coming out. When a tool call returns empty and your agent quietly fabricates an answer, nothing throws. But a context quality metric will show you exactly what happened and give Vega something to reason across when it investigates.
Add this to your agent’s tool call handler (agent.py):
The traced_span, metric, and logger functions are defined in the demo repo’s agent.py. Clone the repo to see the full implementation.
Two lines of instrumentation: one metric, one log. The metric gives Vega a threshold to watch, and the log gives it the surrounding context to reason with when that threshold is breached.
Step 2: Create the Alert
In LaunchDarkly, go to Observe → Alerts → New and fill in the following:
- Alert title:
AI agent empty context spike - Source: Logs
- Filters:
agent.empty_context_rate - Environment: Select your environment (e.g.,
dev) - Function:
Count - Alert threshold type: Constant
- Alert conditions: Above
- Alert threshold:
0.15(this is treated as a rate) - Alert window:
30 minutes - Cooldown:
30 minutes
-
+ Add notification: Click this and select your Slack channel (e.g.,
#on-callor#ai-alerts). I called my channel#alexis-test-oncall-vega-channel. Vega results will be sent to this channel. -
Auto remediation: Toggle this on. This expands additional options:
- Agent mode:
Investigate. Vega will analyze the alert and deliver a root cause summary - Remediation cooldown:
1 day - Custom prompt: (optional) Add context to guide Vega’s investigation, e.g., “Focus on empty tool call results and upstream data source issues”
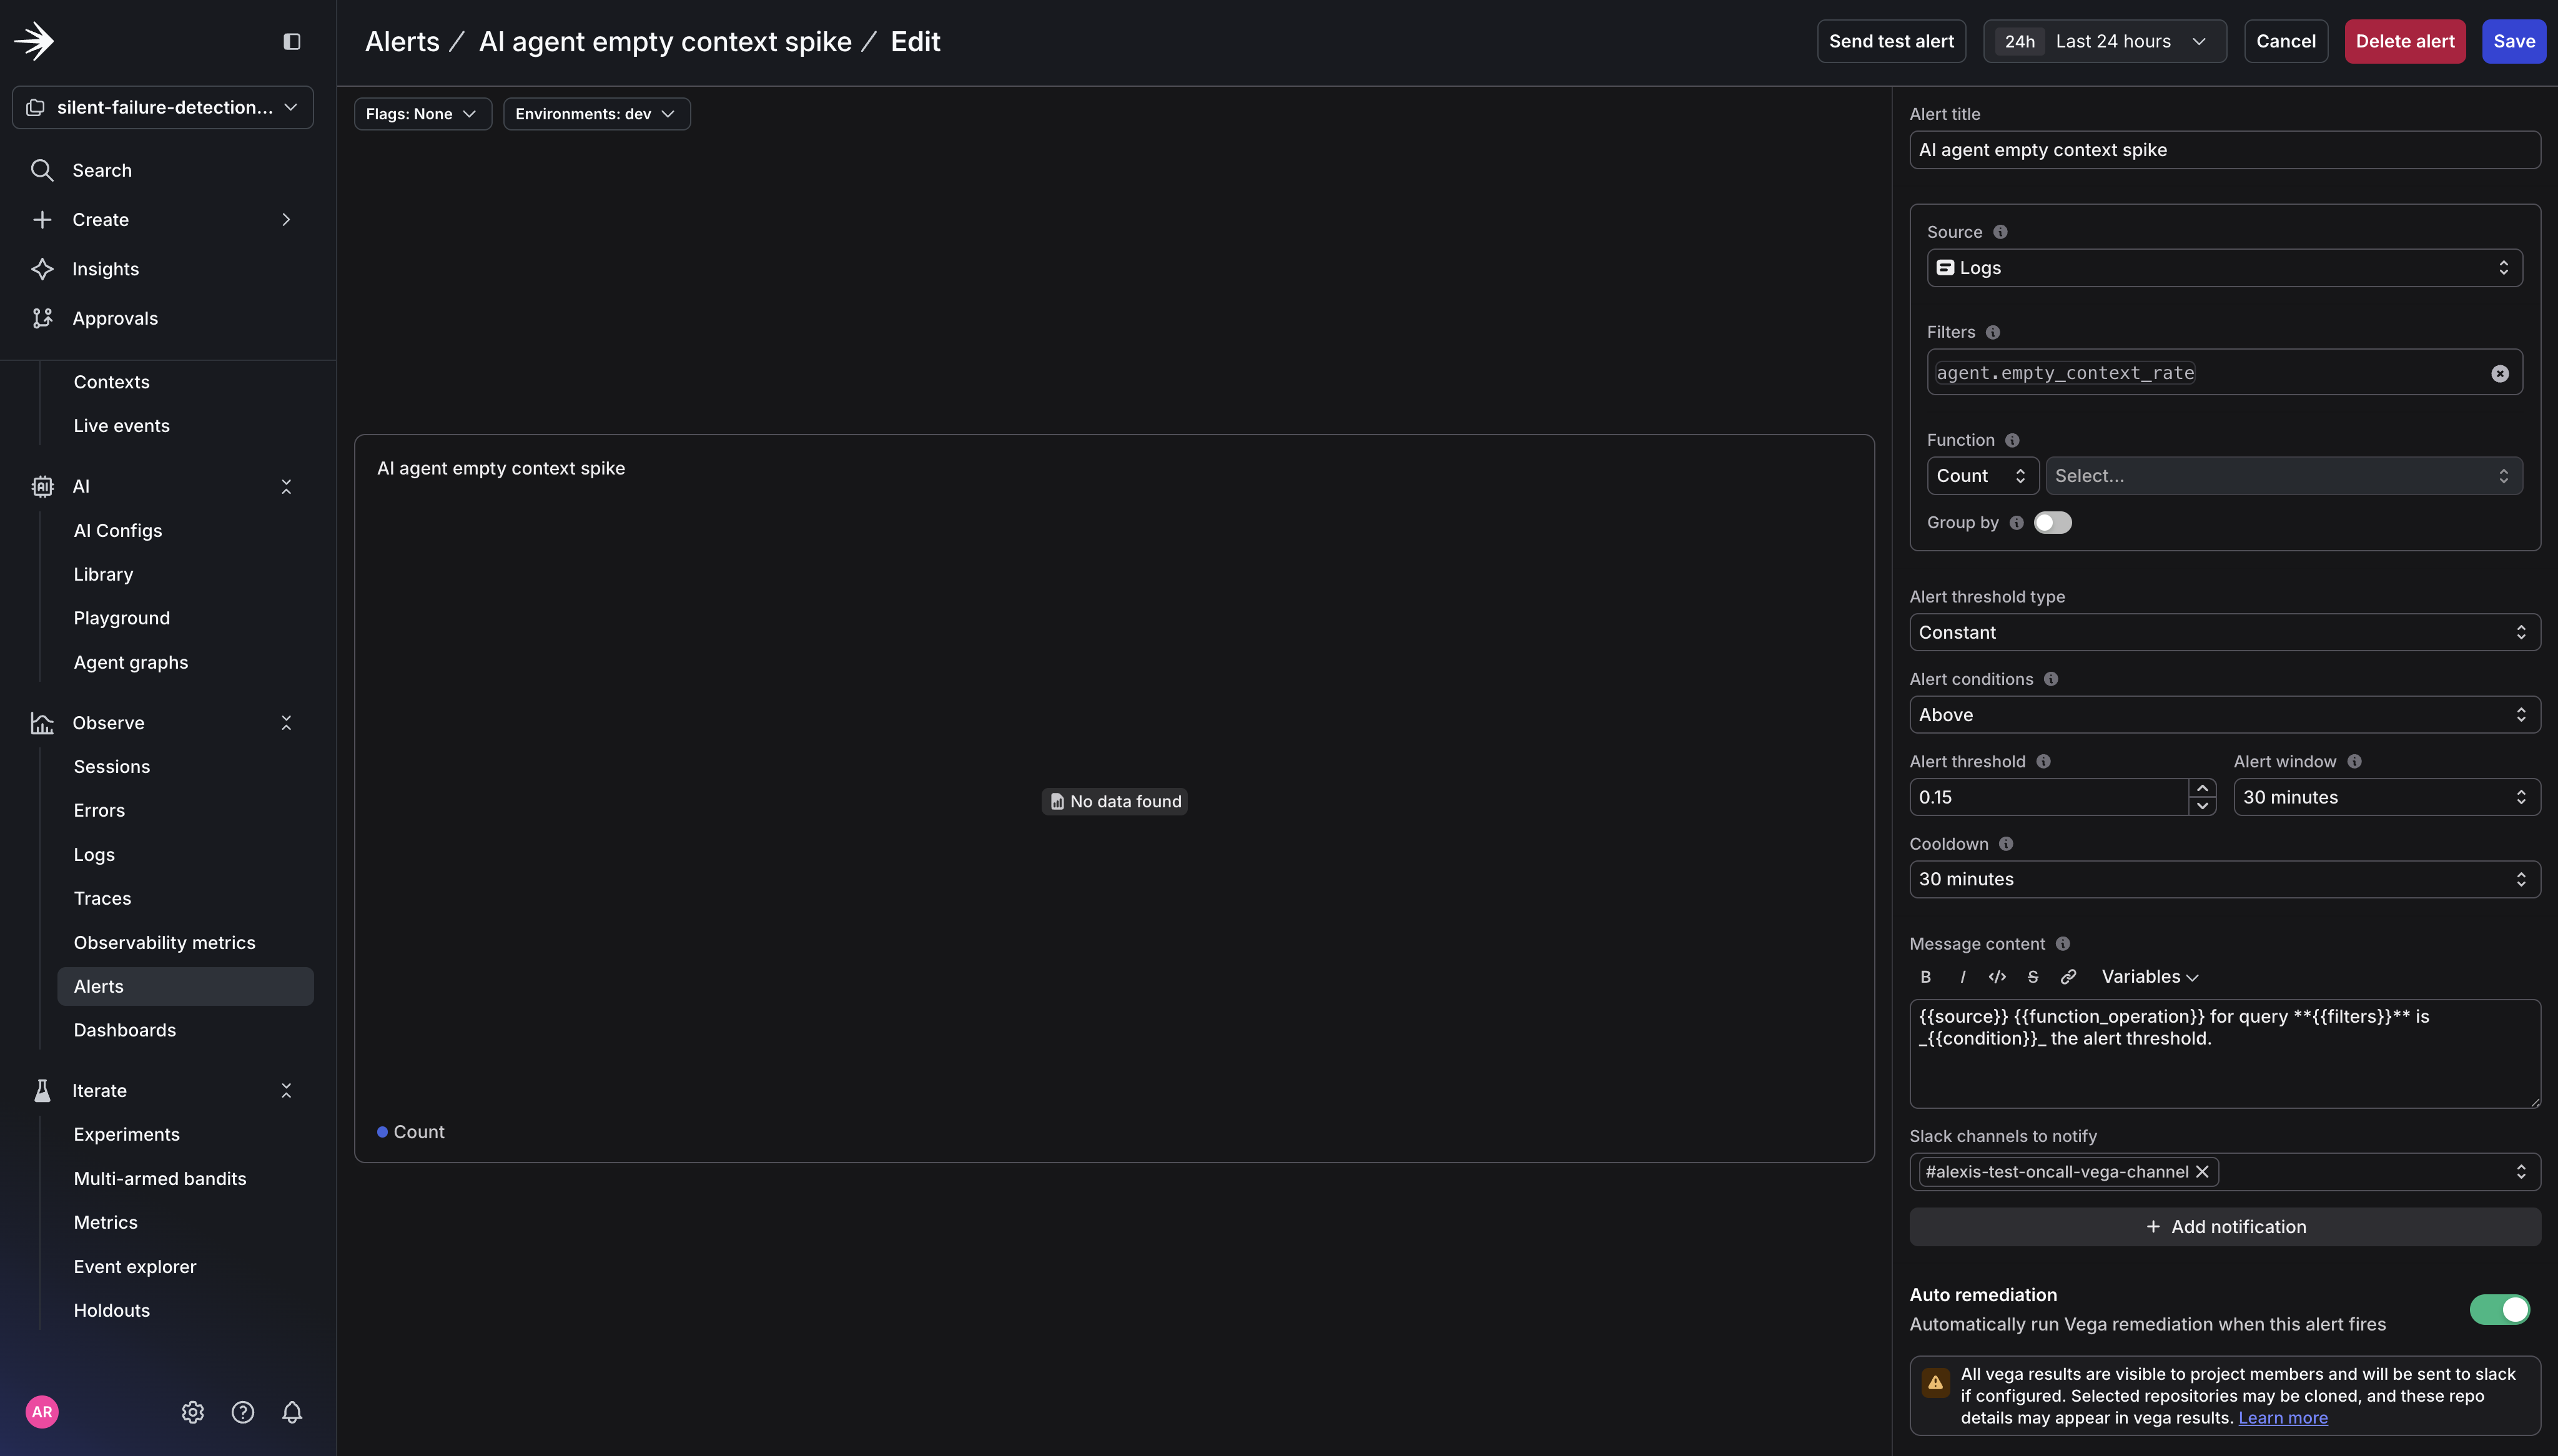
Save the alert. Vega is now watching.
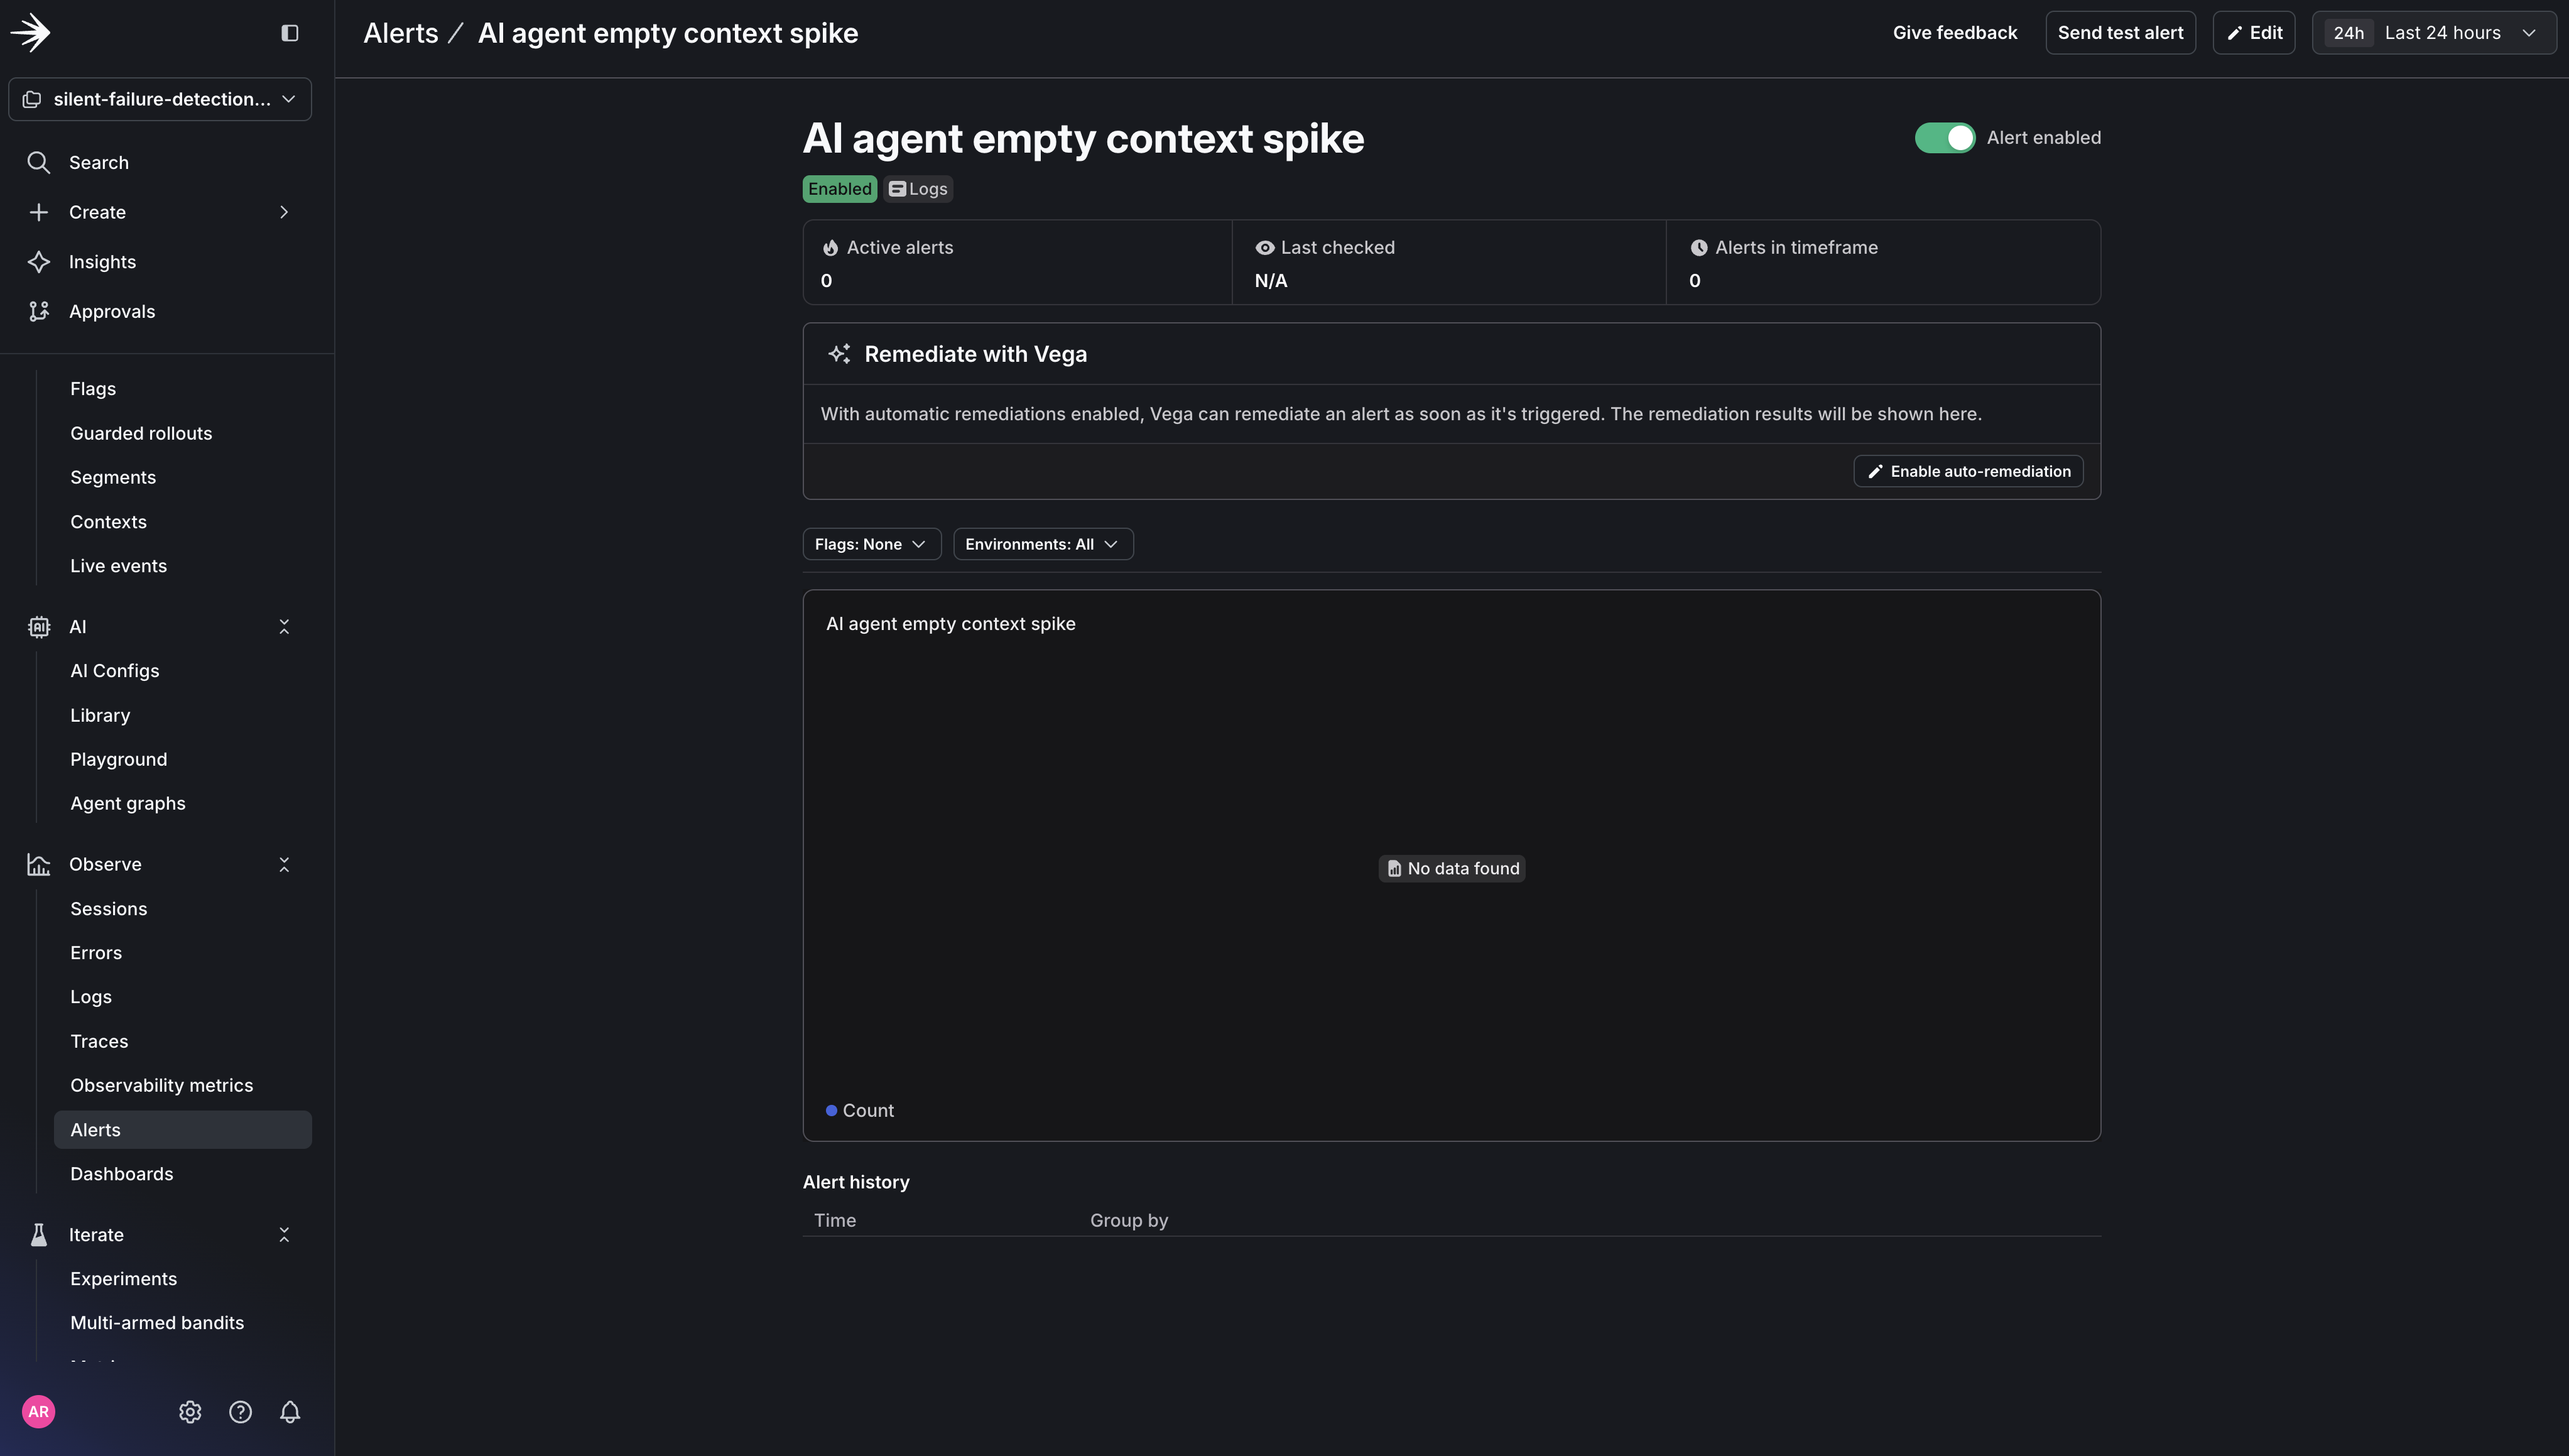
The threshold is the key decision here. A small baseline of empty results is normal: new users with no order history, optional tools that don’t always apply. But a spike above your threshold means your agent is flying blind for a meaningful share of real requests, and that’s the signal worth waking up for.
Step 3: Trigger the Failure
Simulate an upstream data issue by making your tool return empty results for a portion of requests (agent.py):
Run the demo agent to simulate this:
Here’s what the output looks like. Notice how the agent returns confident, well-formed responses even when the tool returns empty:
Text content with multimedia
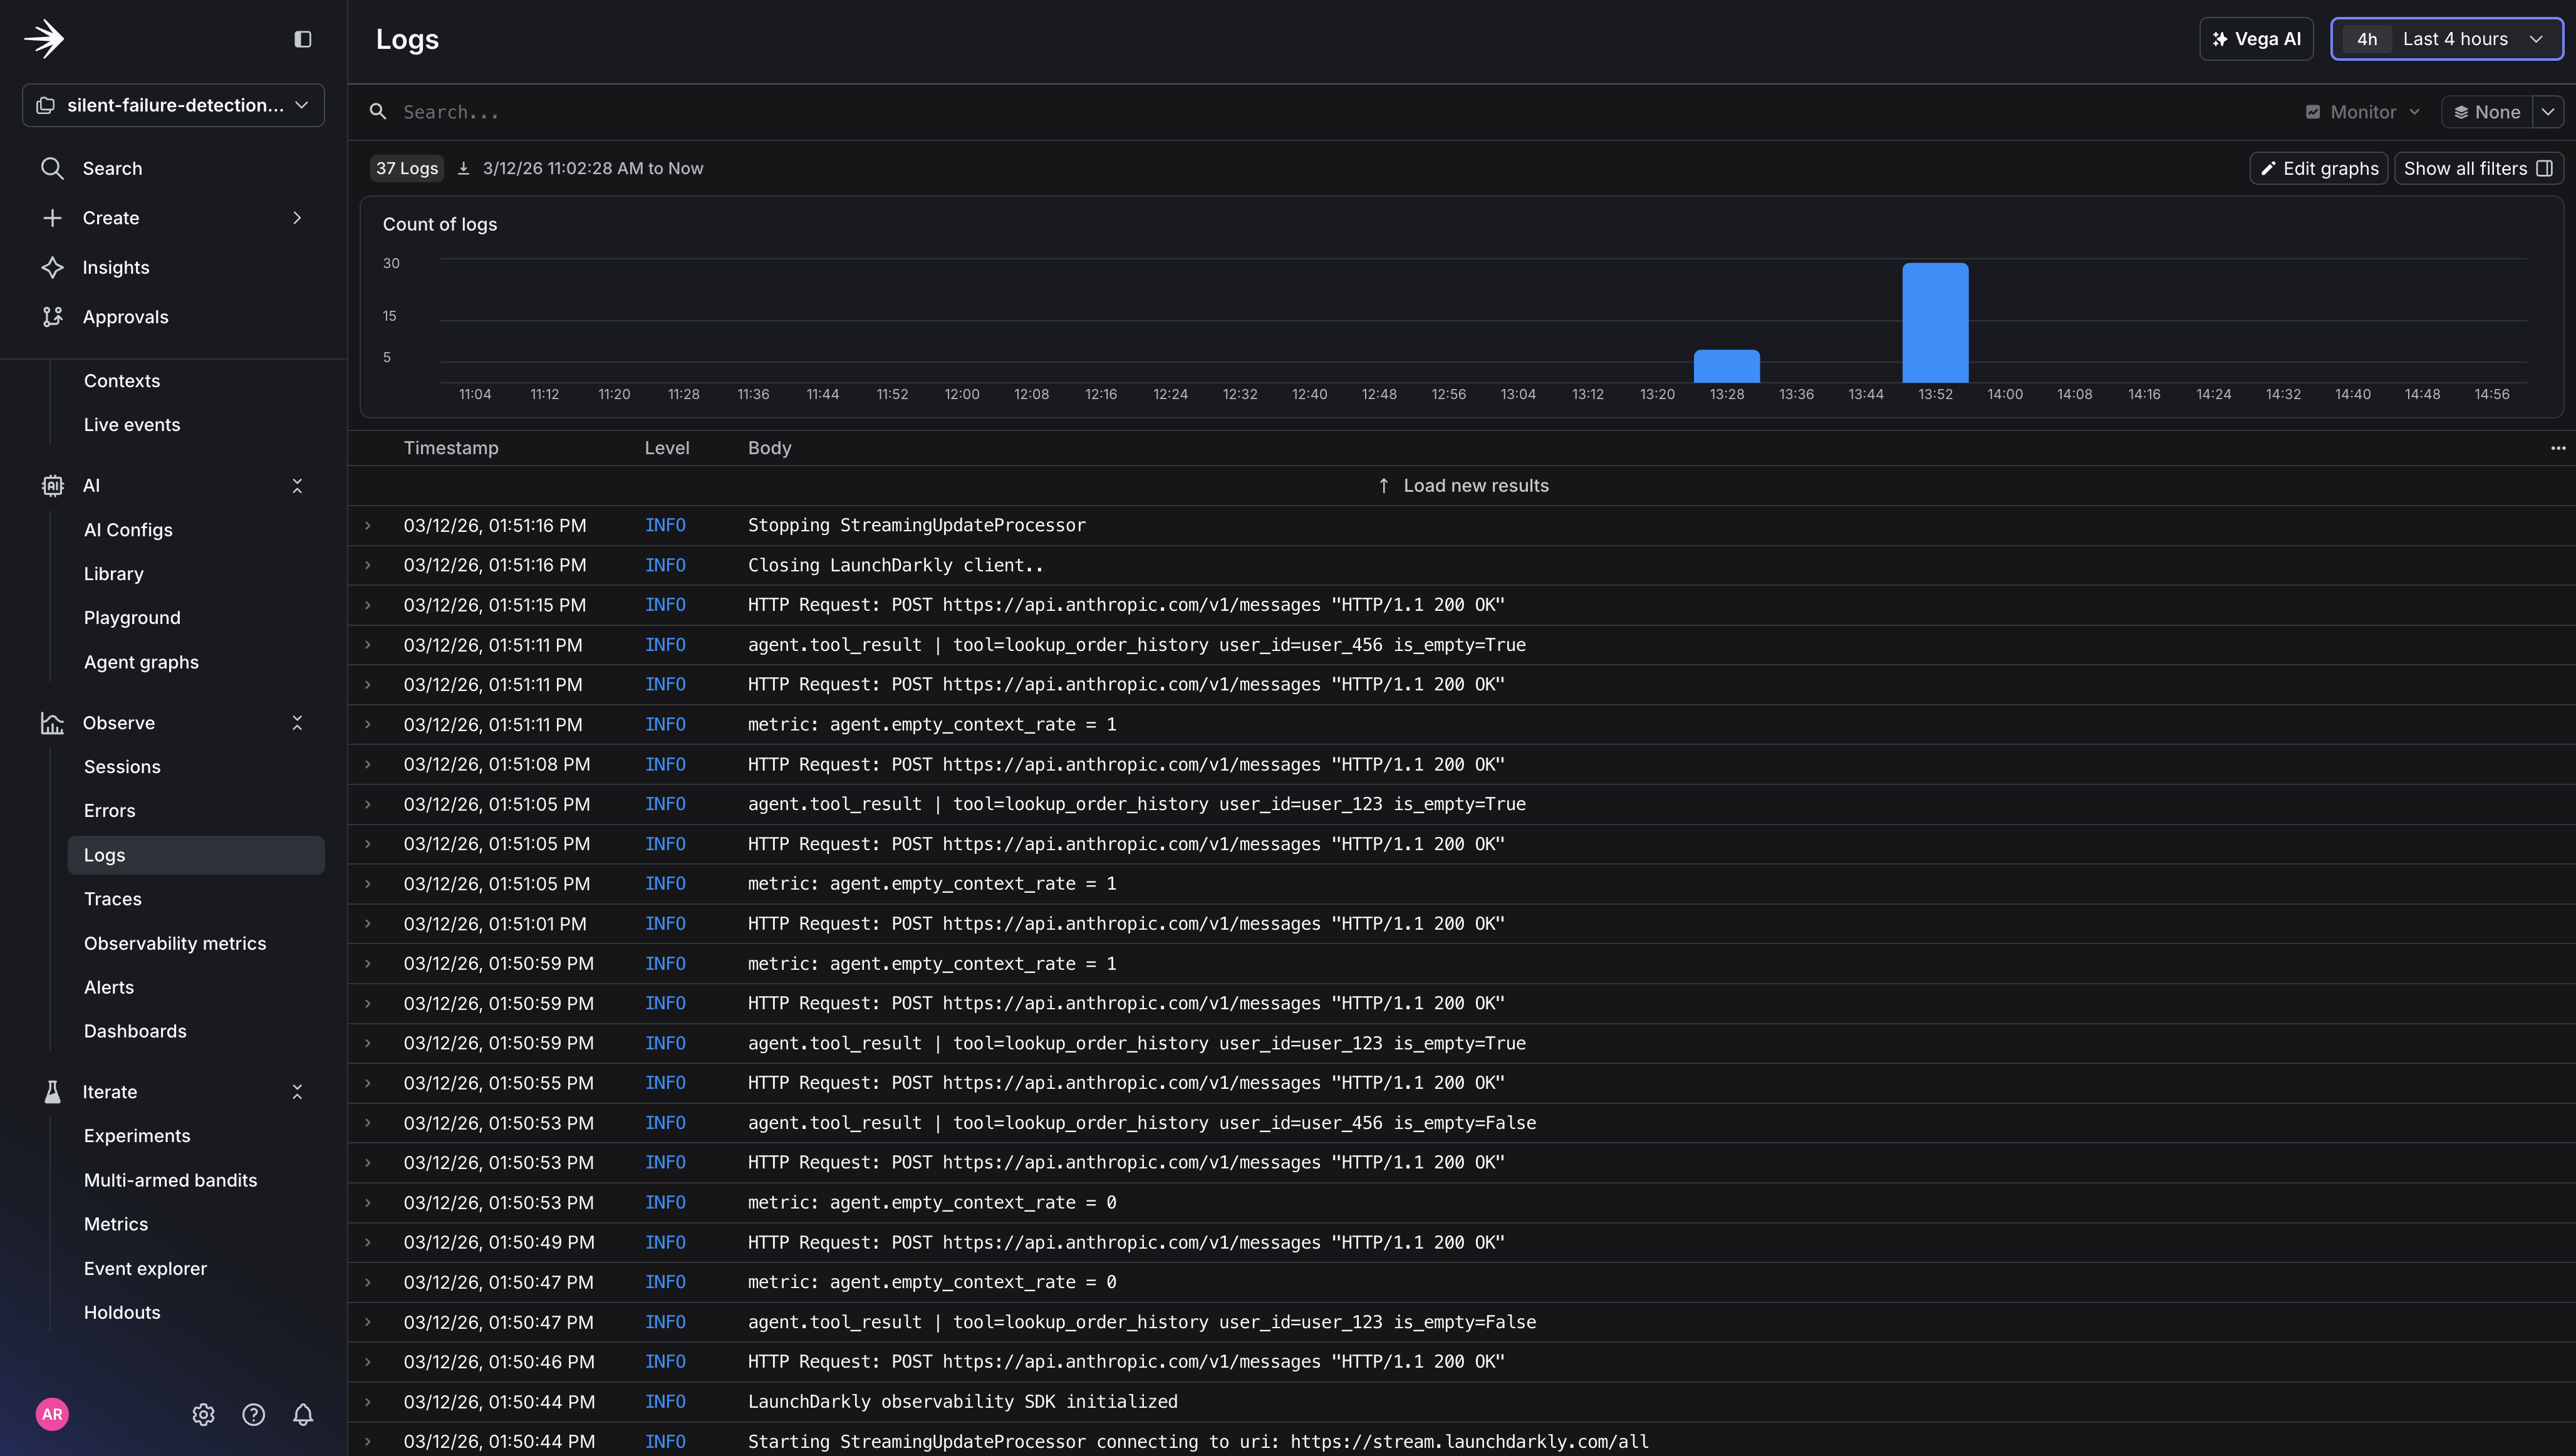
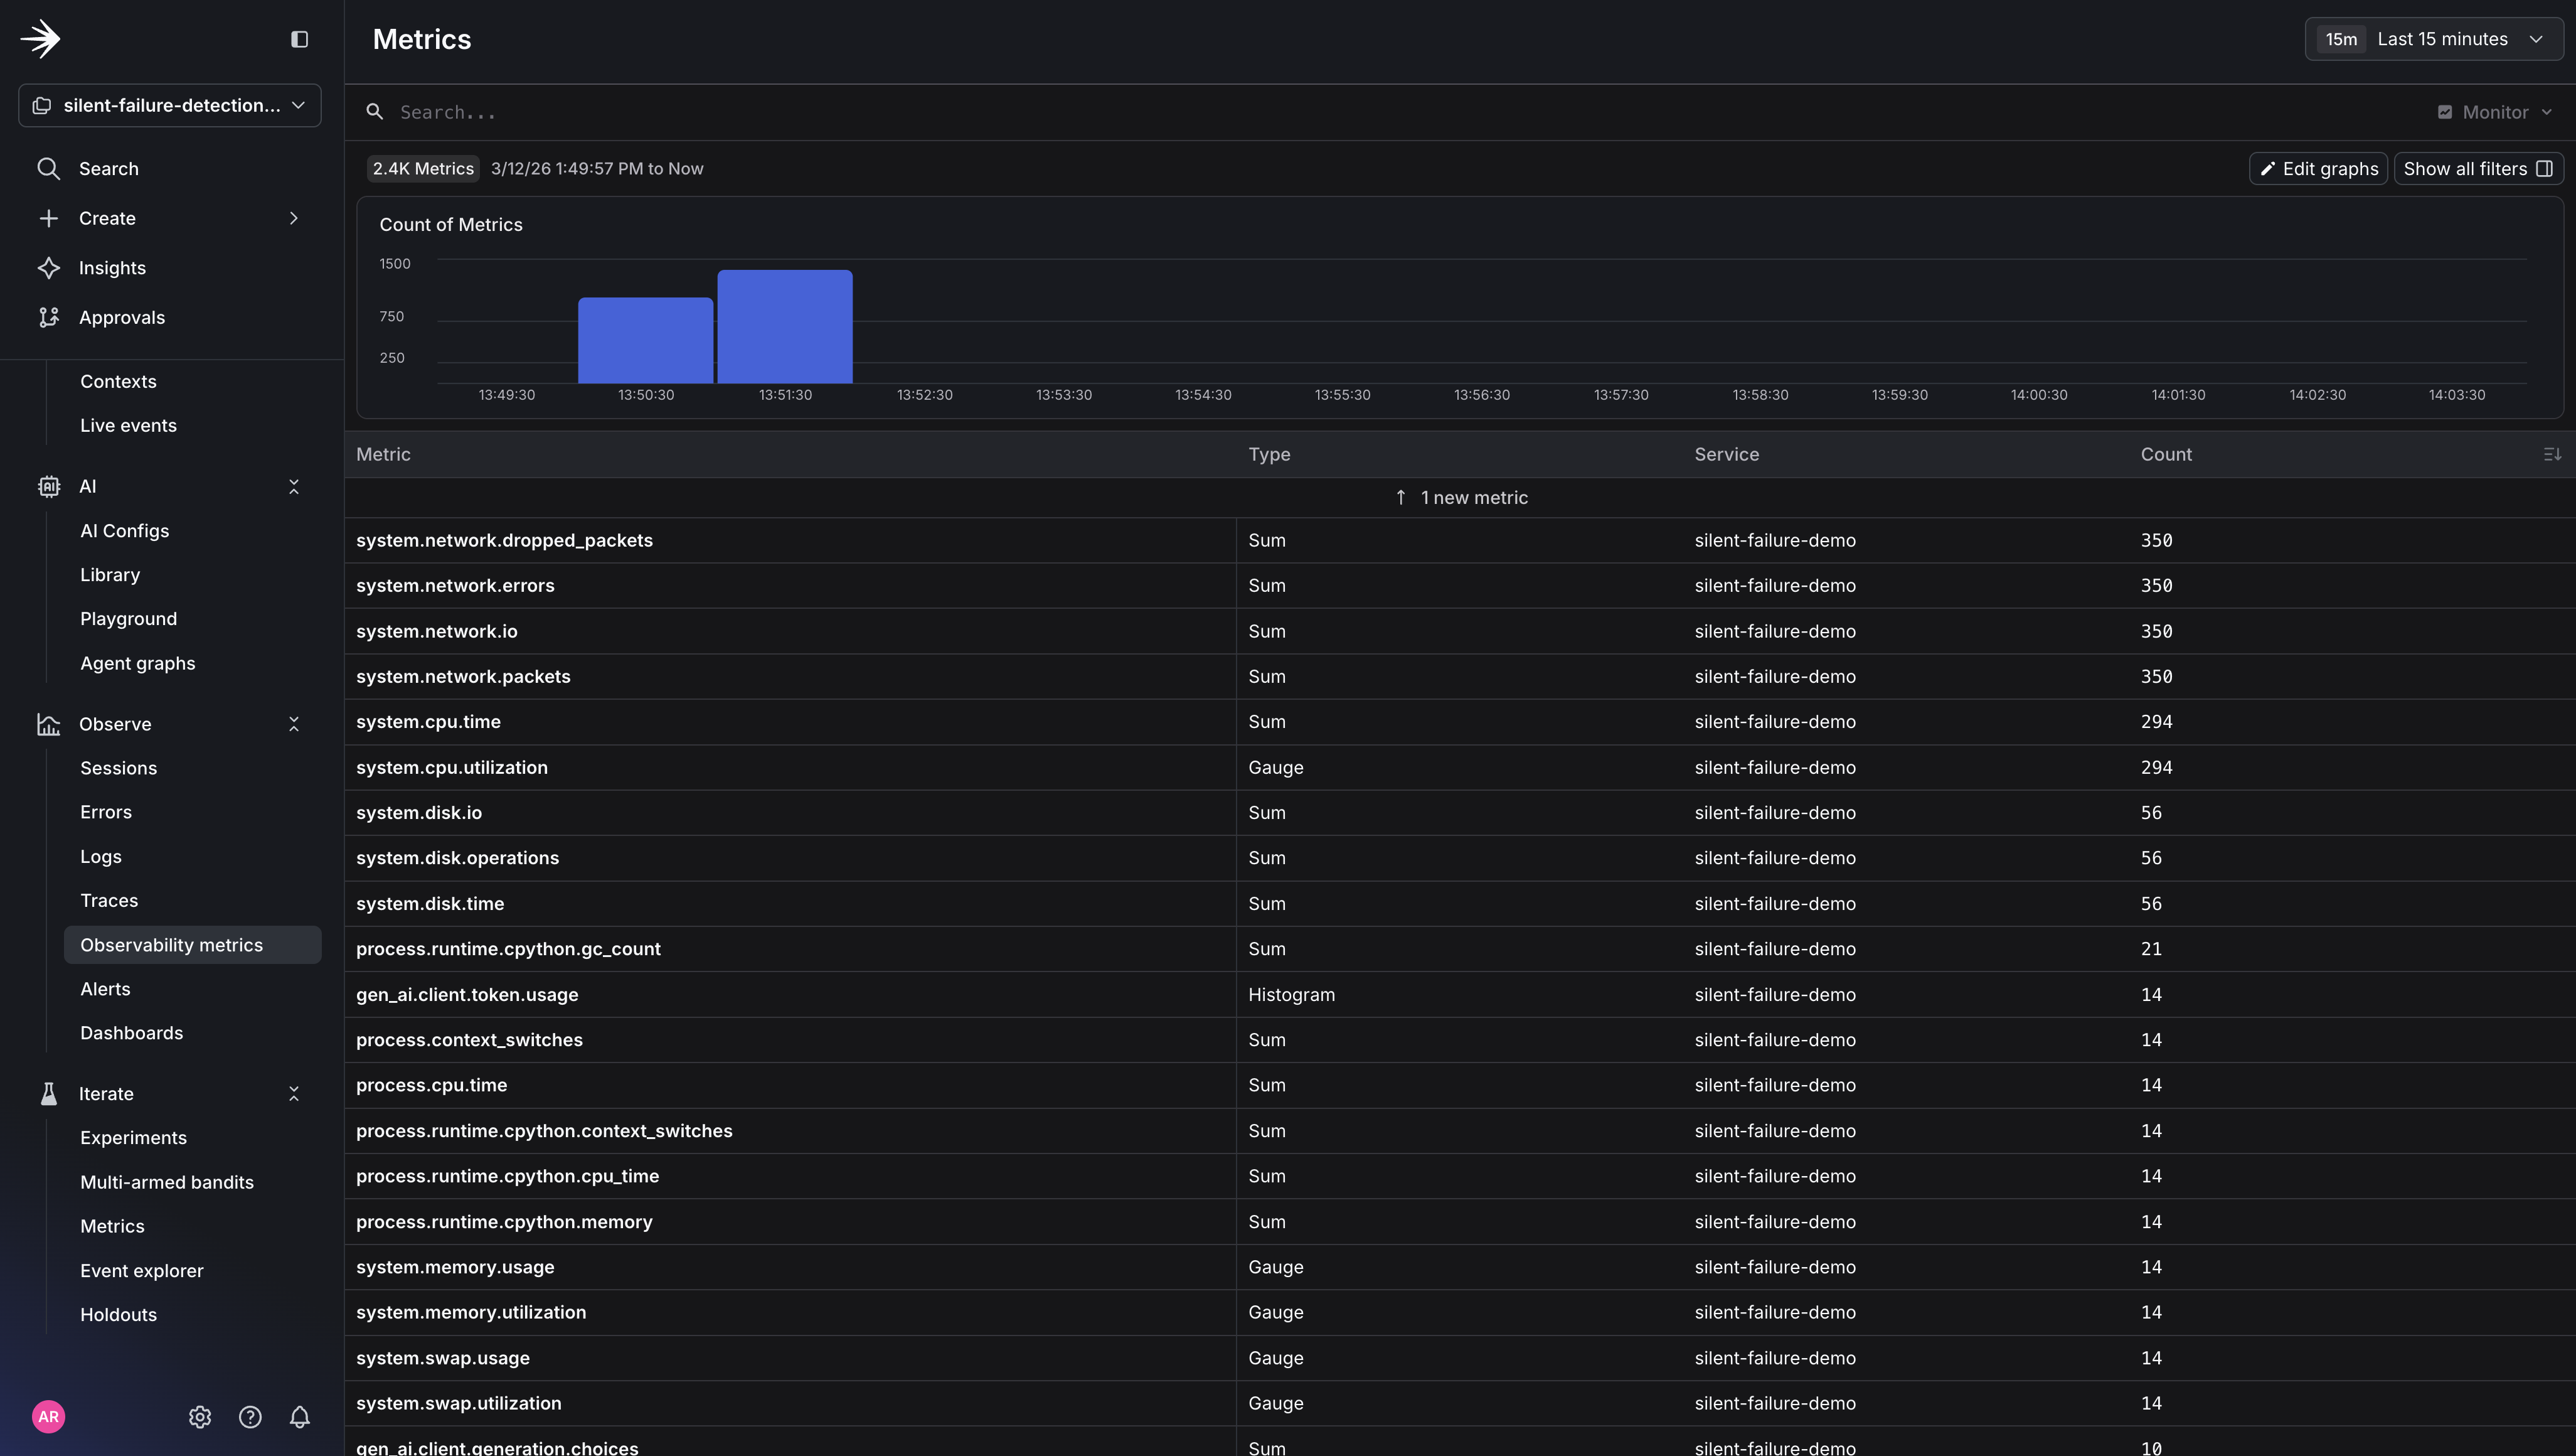
The metric tells the story: 3 out of 5 tool calls returned empty, pushing the empty context rate to 60%, well above the 15% threshold. But here’s what stays completely flat the entire time: HTTP error rate, response latency, and every existing monitor you have. From their perspective, nothing is wrong. Your agent is returning 200s with confident, well-formed responses that happen to be made up.
Step 4: Read the Investigation
When the alert fires, you’ll get a notification in your Slack channel. The alert tells you what breached (agent.empty_context_rate crossed 15%) but not why.
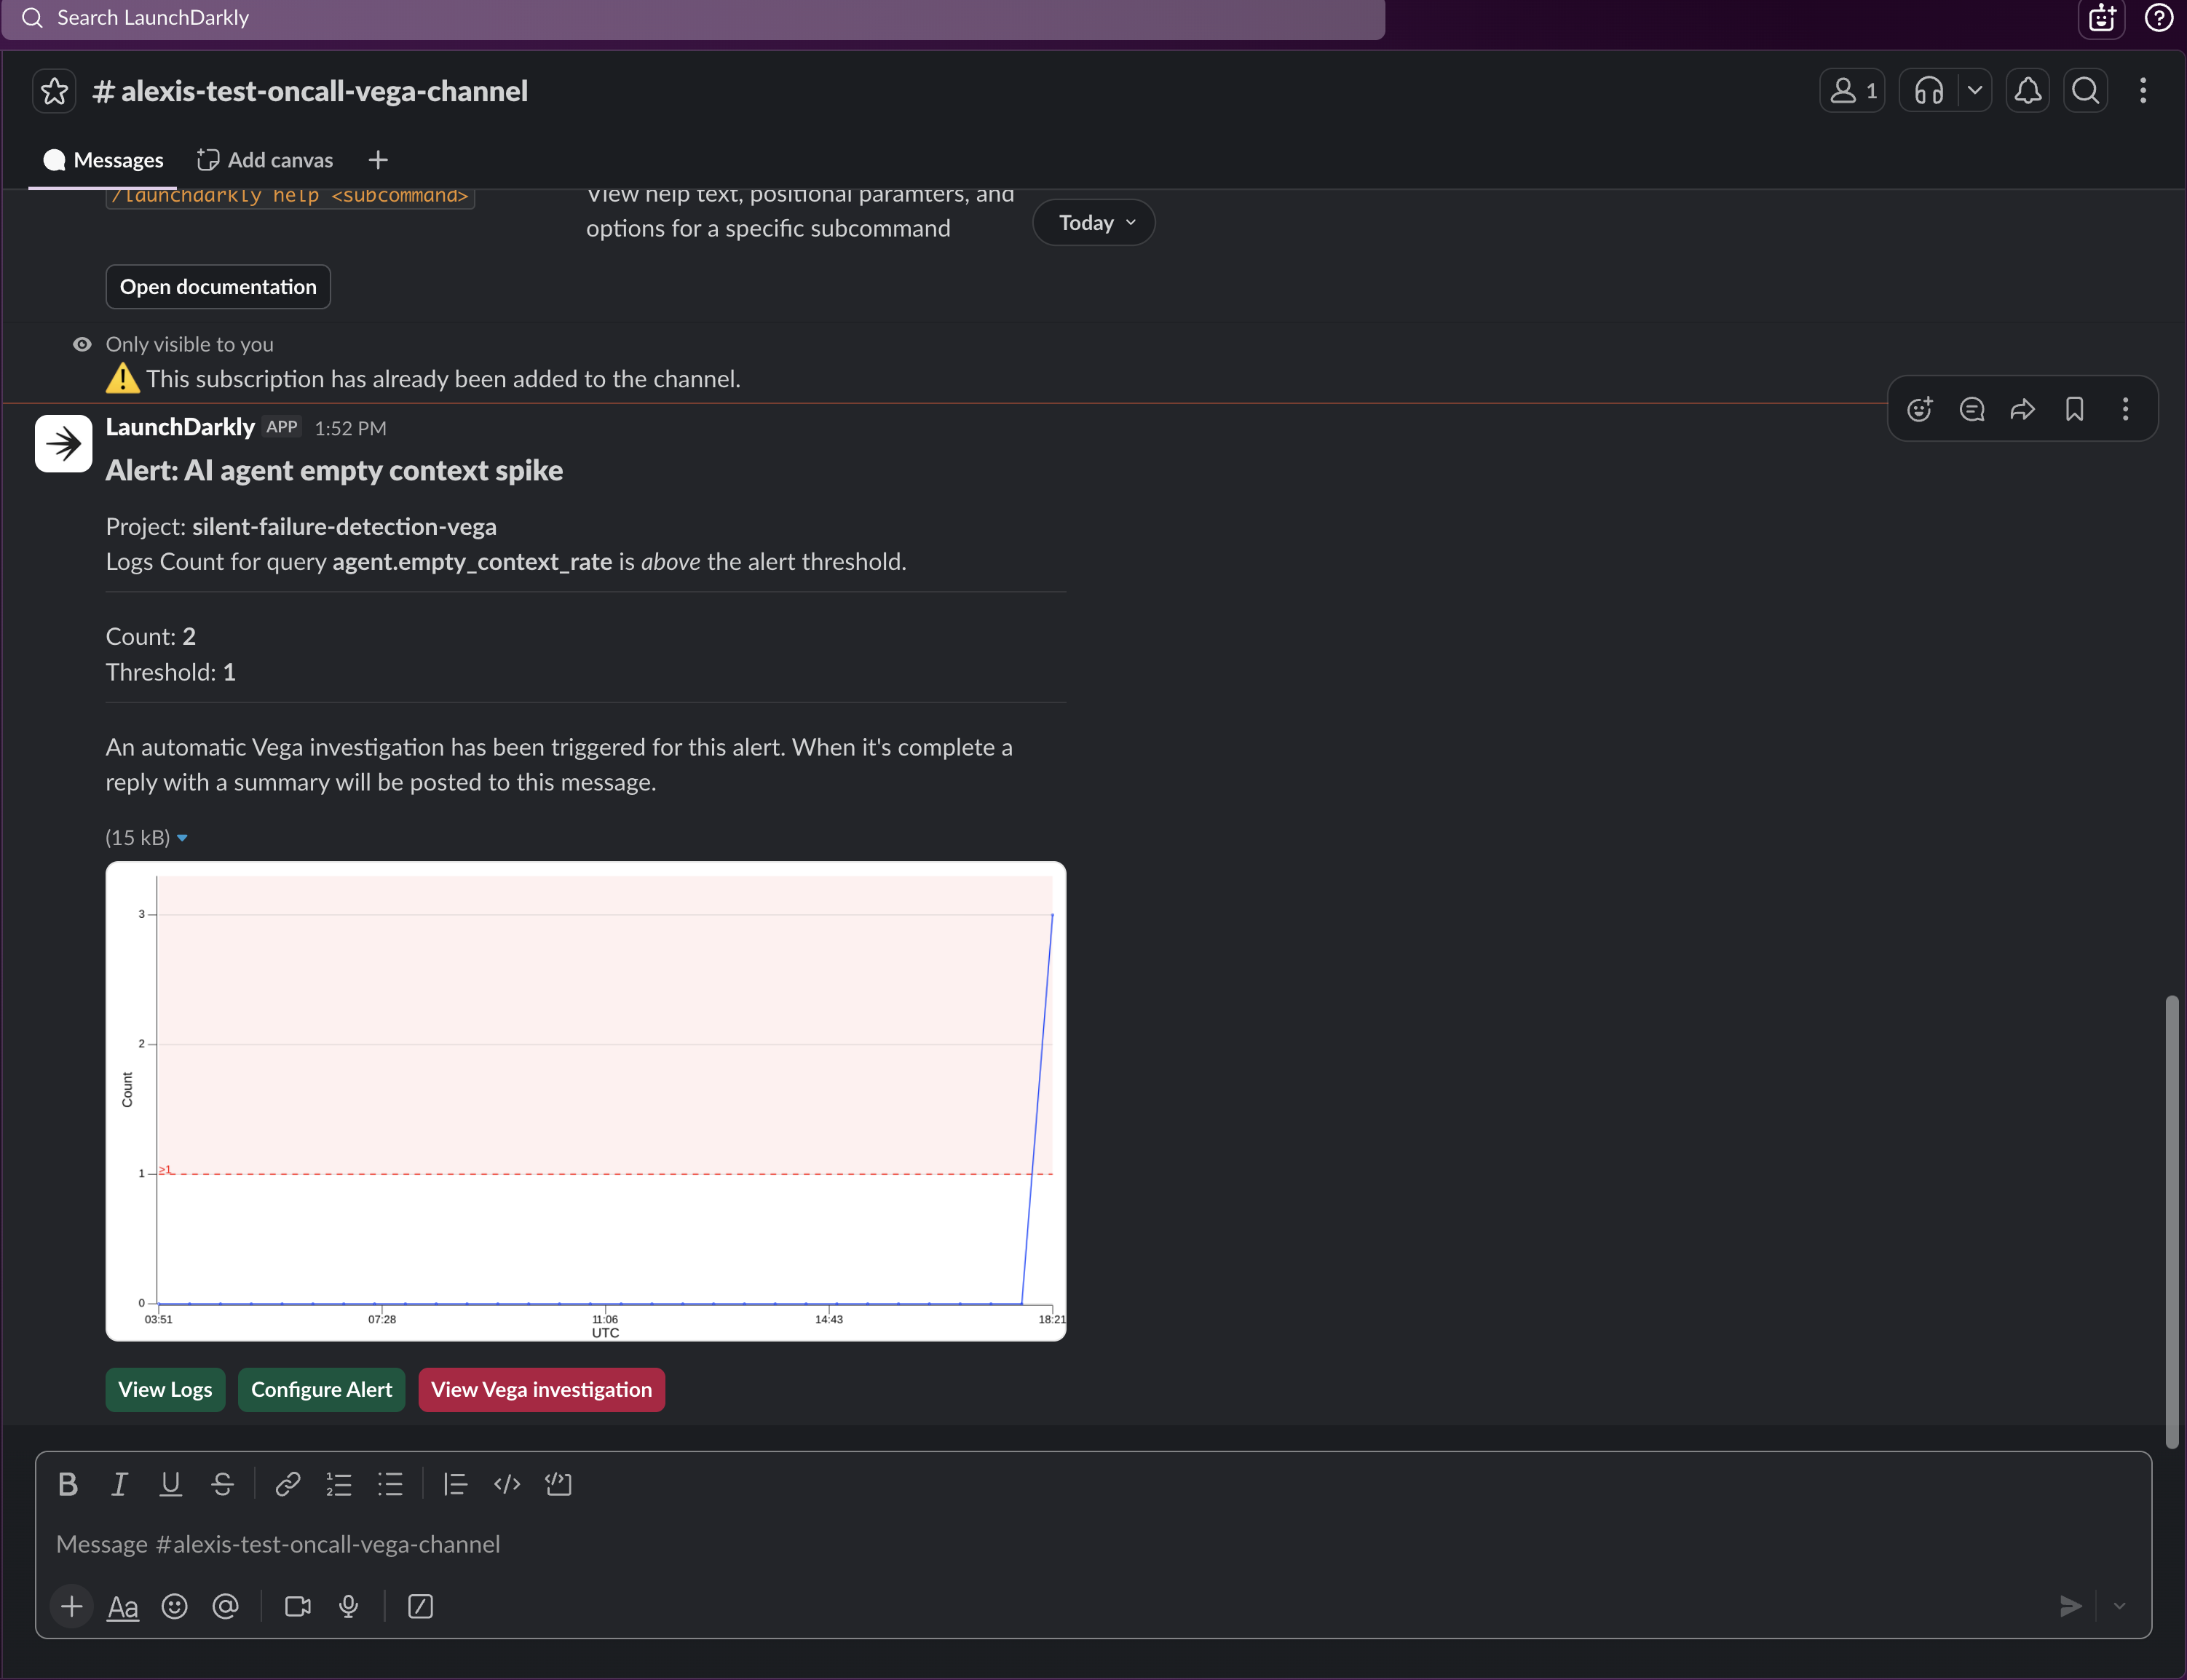
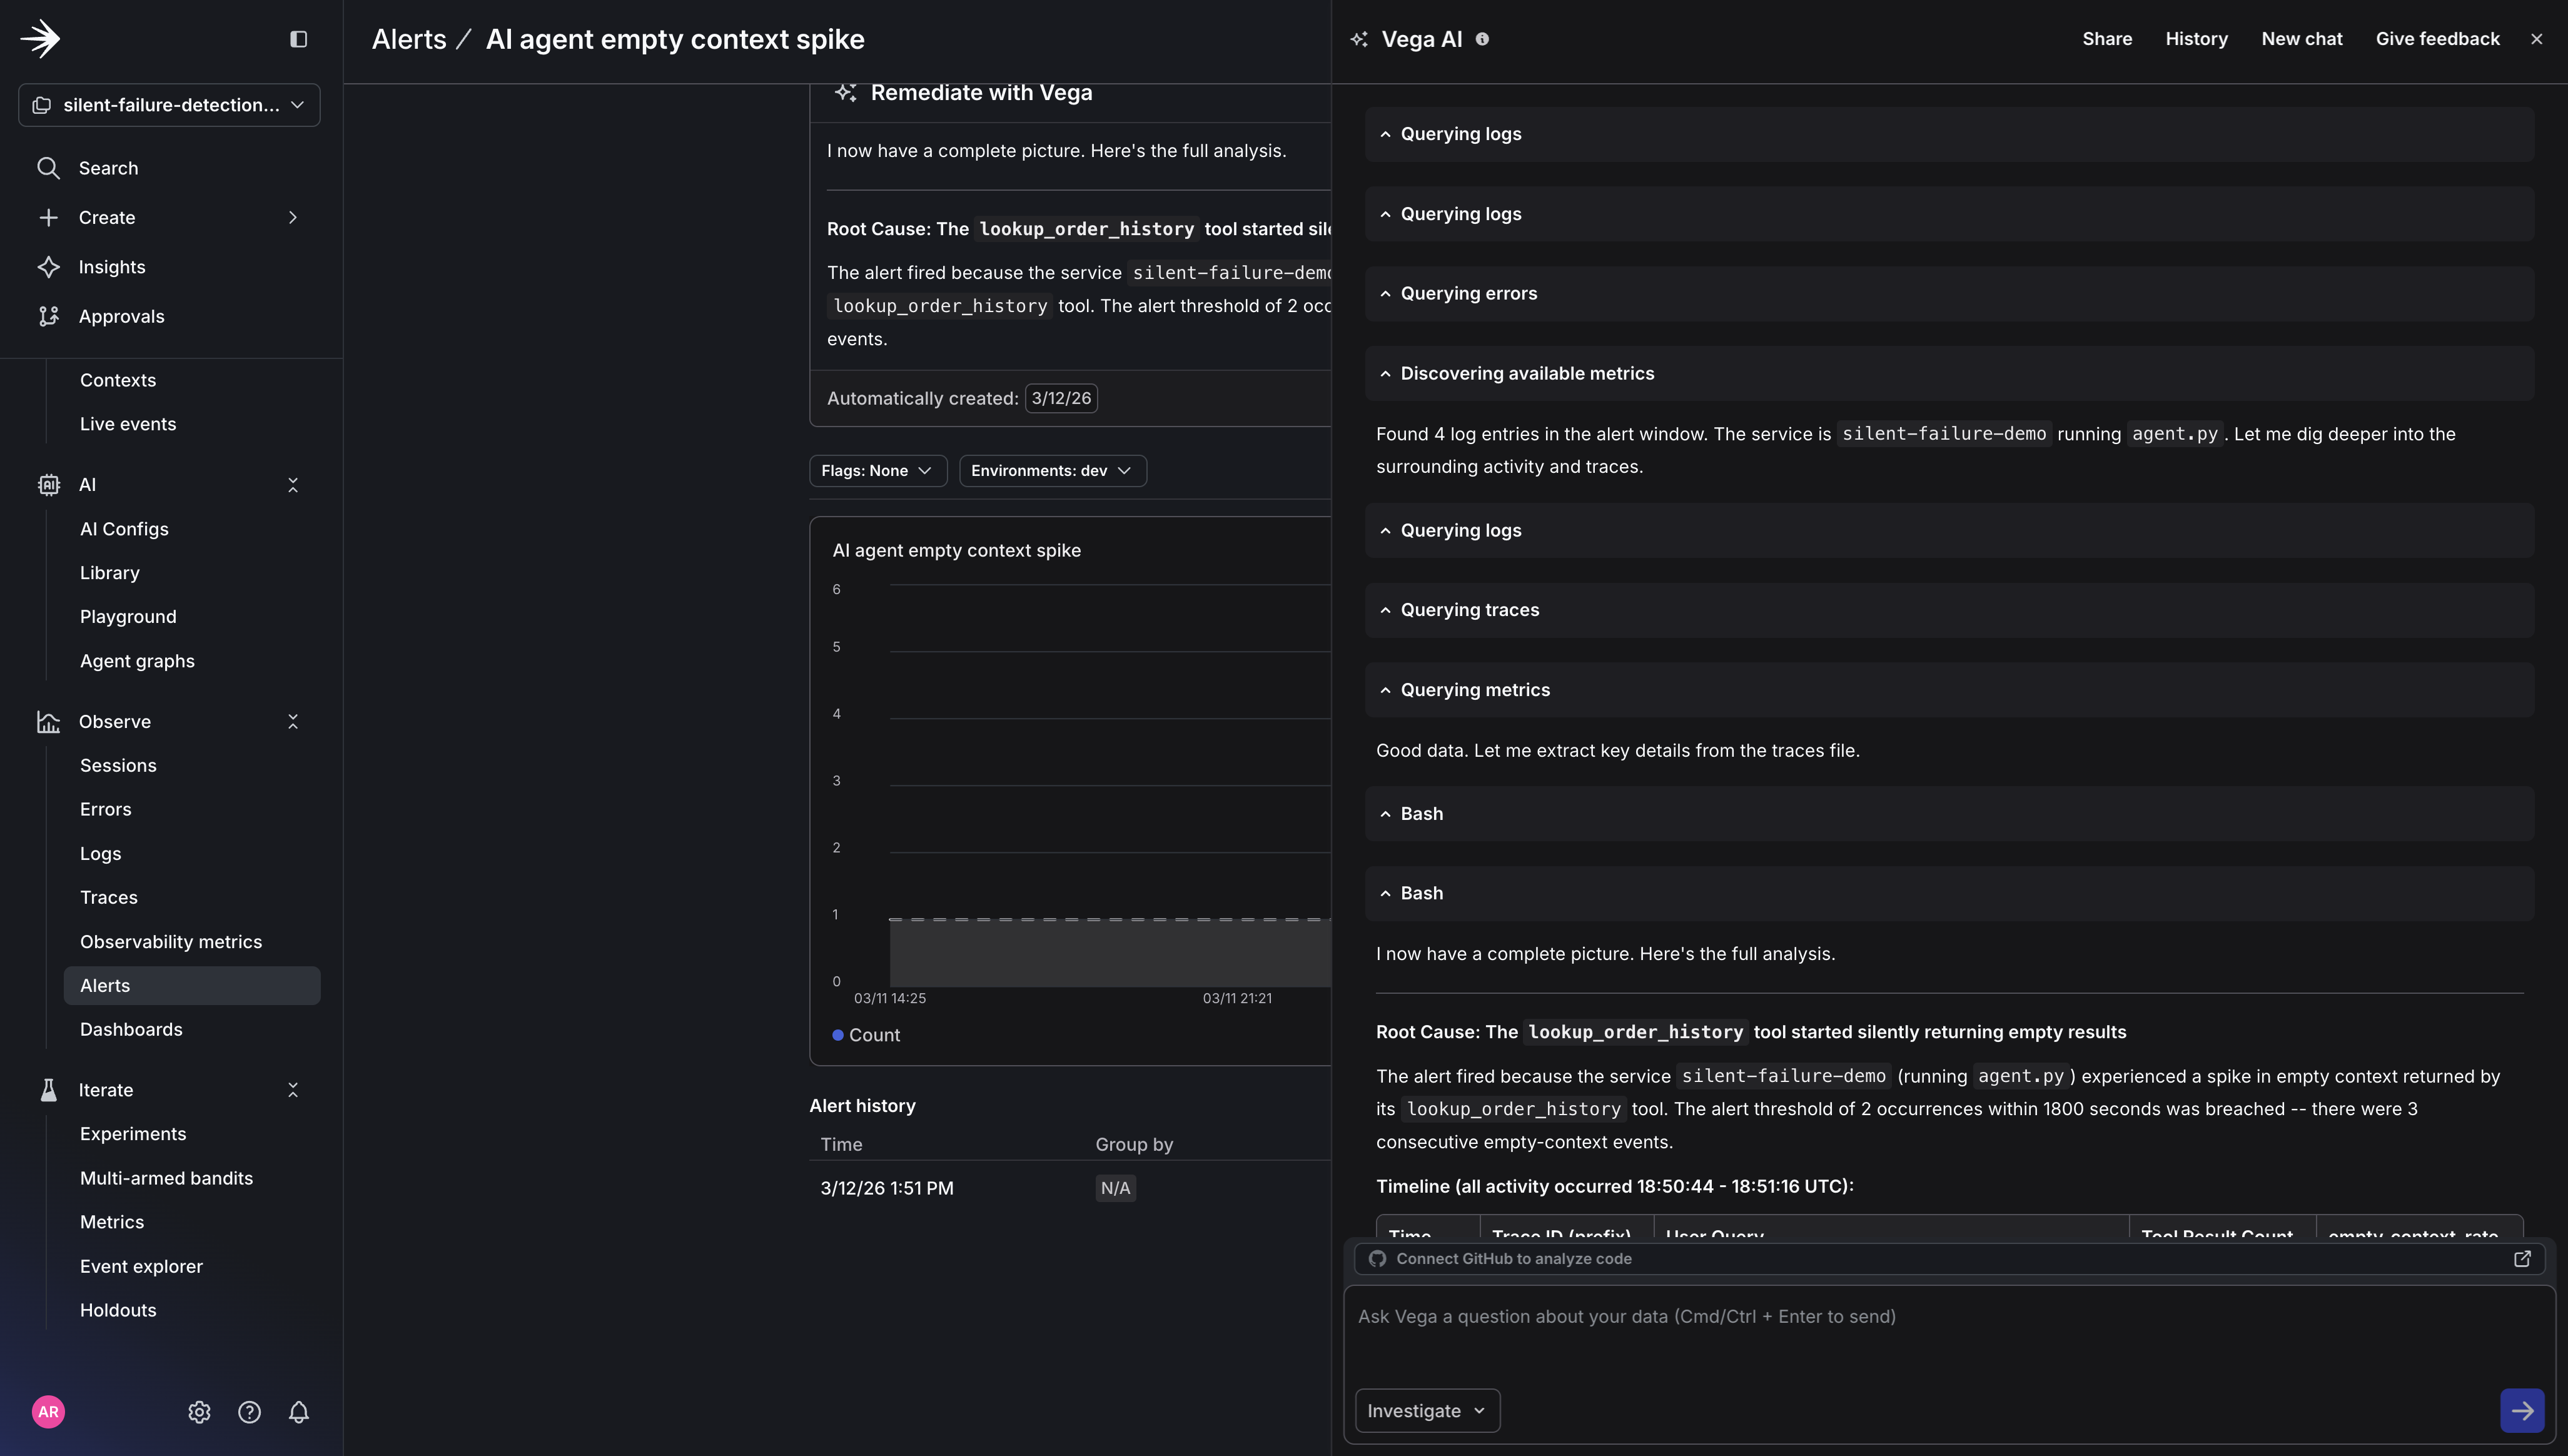
Click Run Vega Investigation from the alert. Vega analyzes the correlated logs, traces, and metrics and delivers a root cause summary. The investigation will look something like this:
Root cause identified: agent.empty_context_rate climbed from a 3% baseline to 38% over the last 10 minutes. Log correlation shows lookup_order_history returning empty results across 24 requests. No correlated flag changes or recent deployments. The pattern is consistent with an upstream data source issue rather than a code-level error.
Click View Vega Investigation.
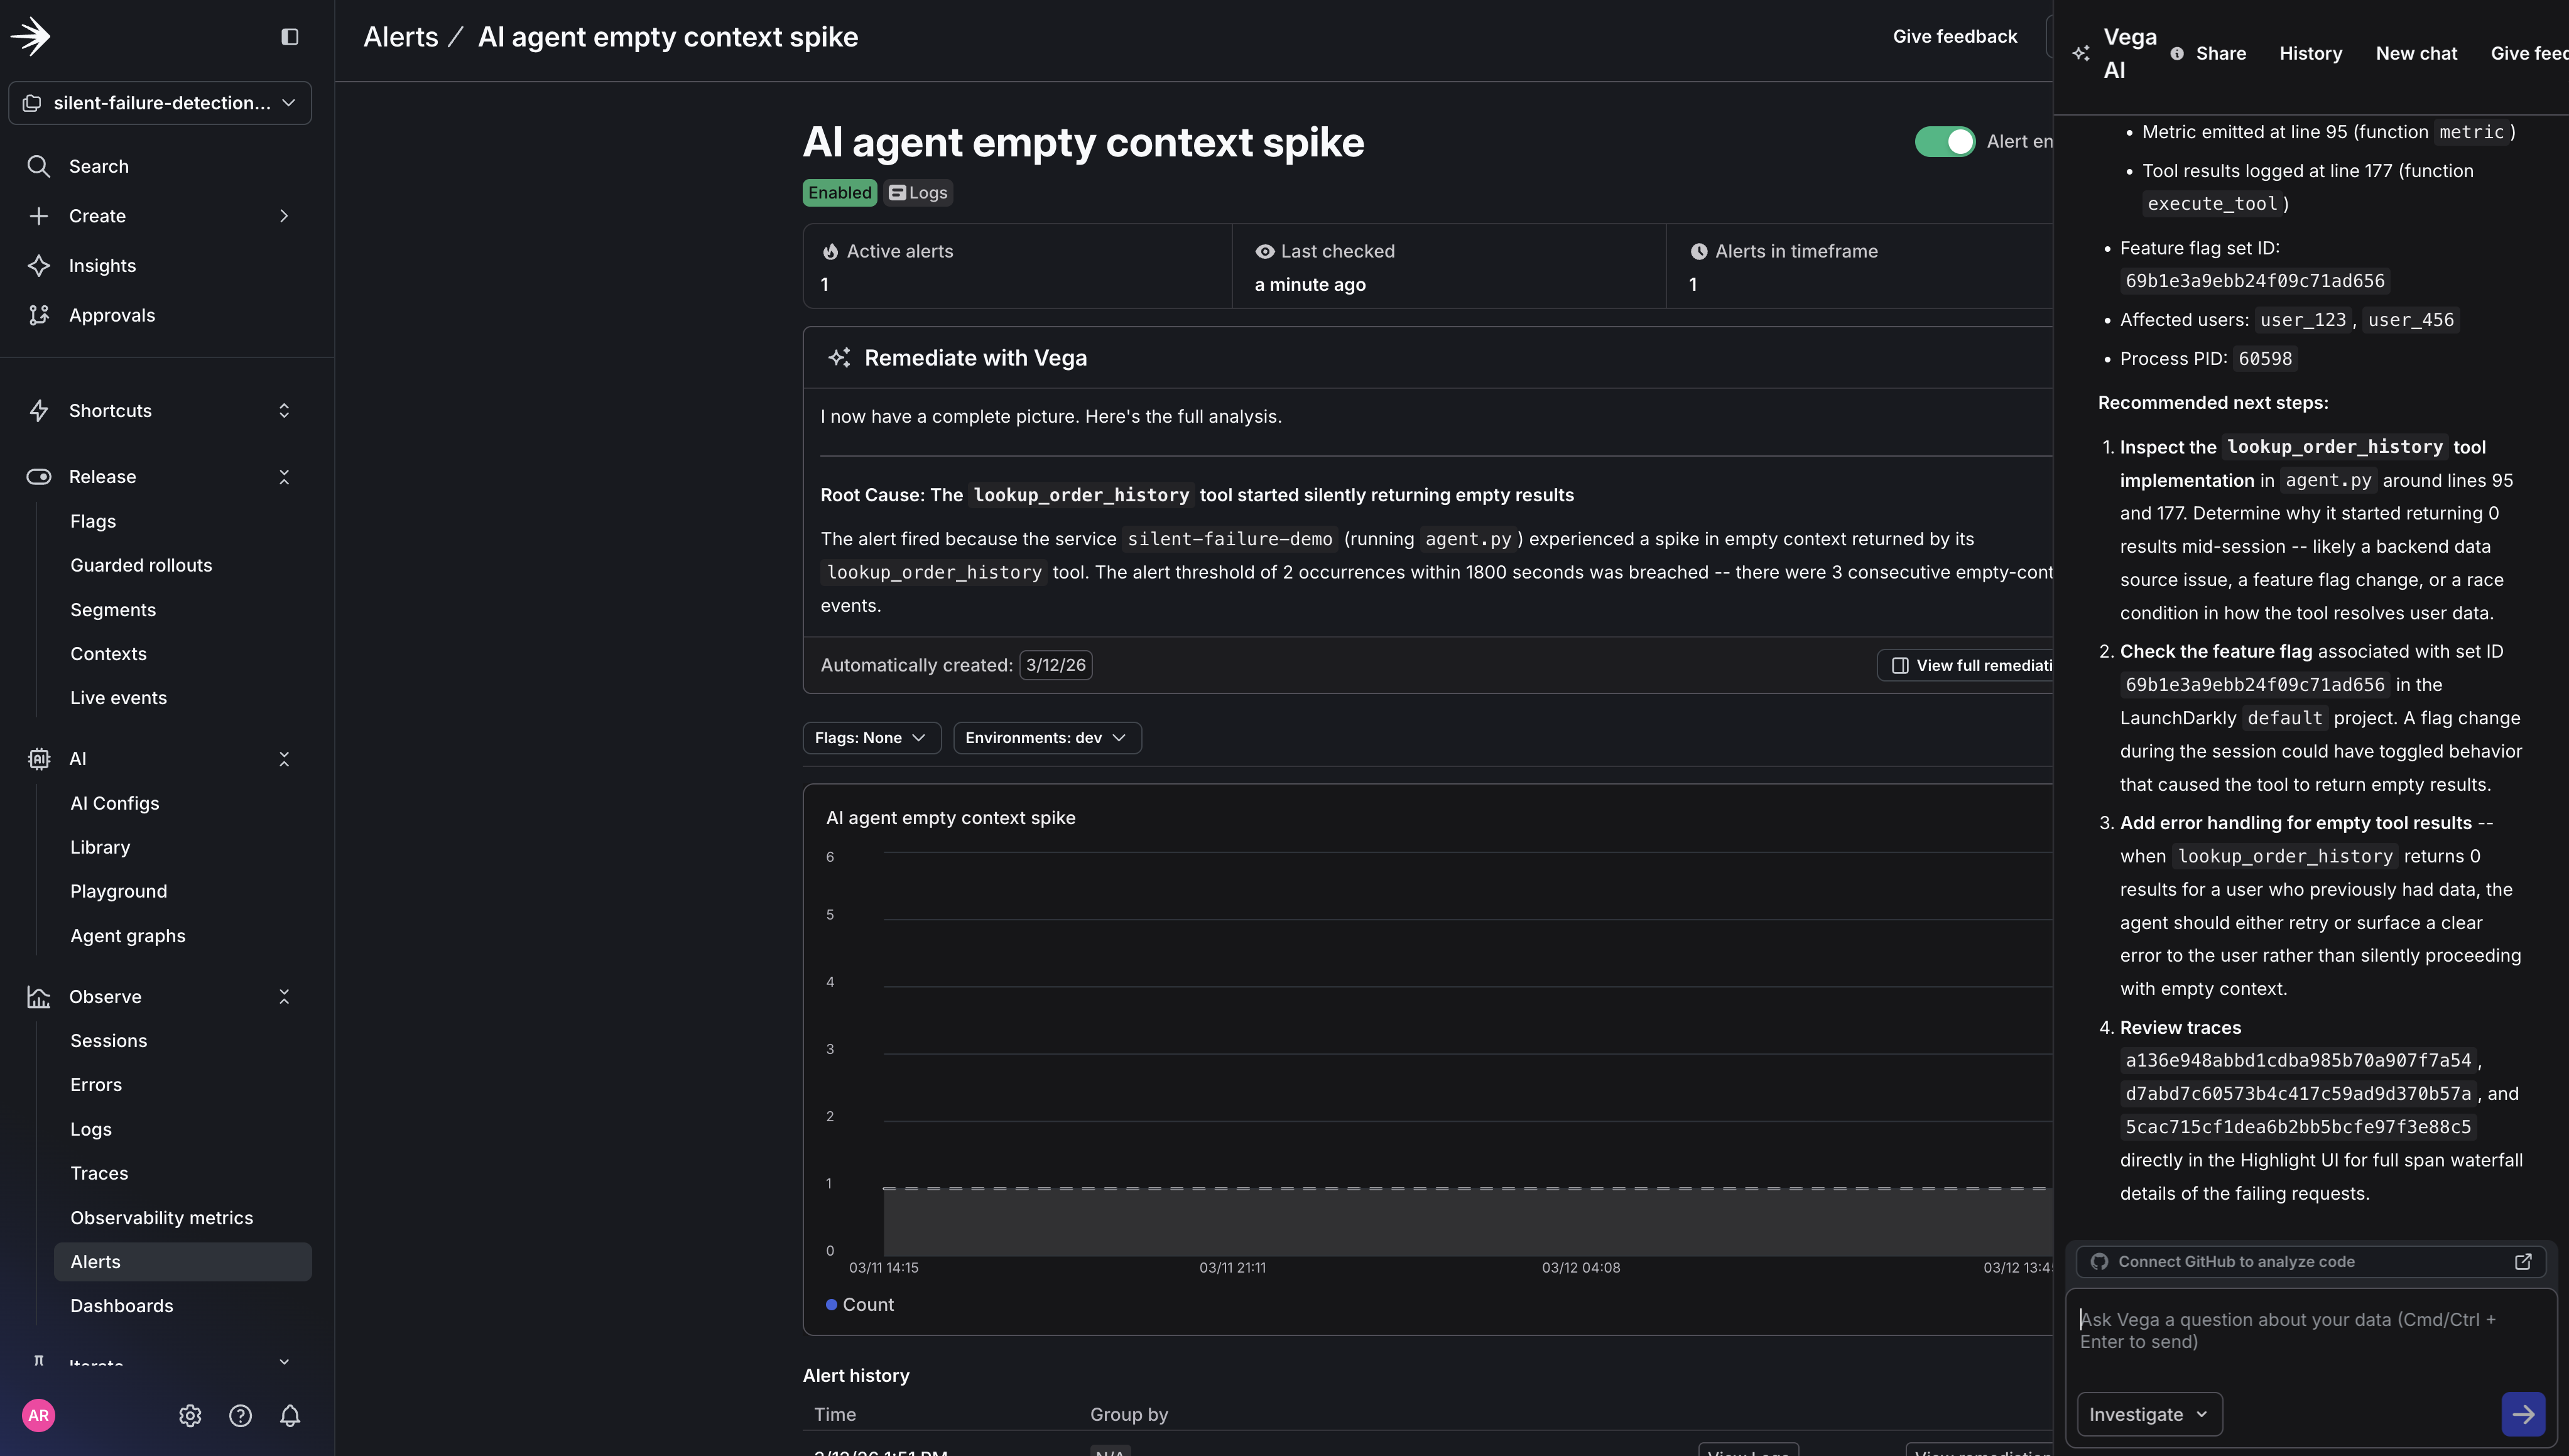
View the full report to the right of the alert.
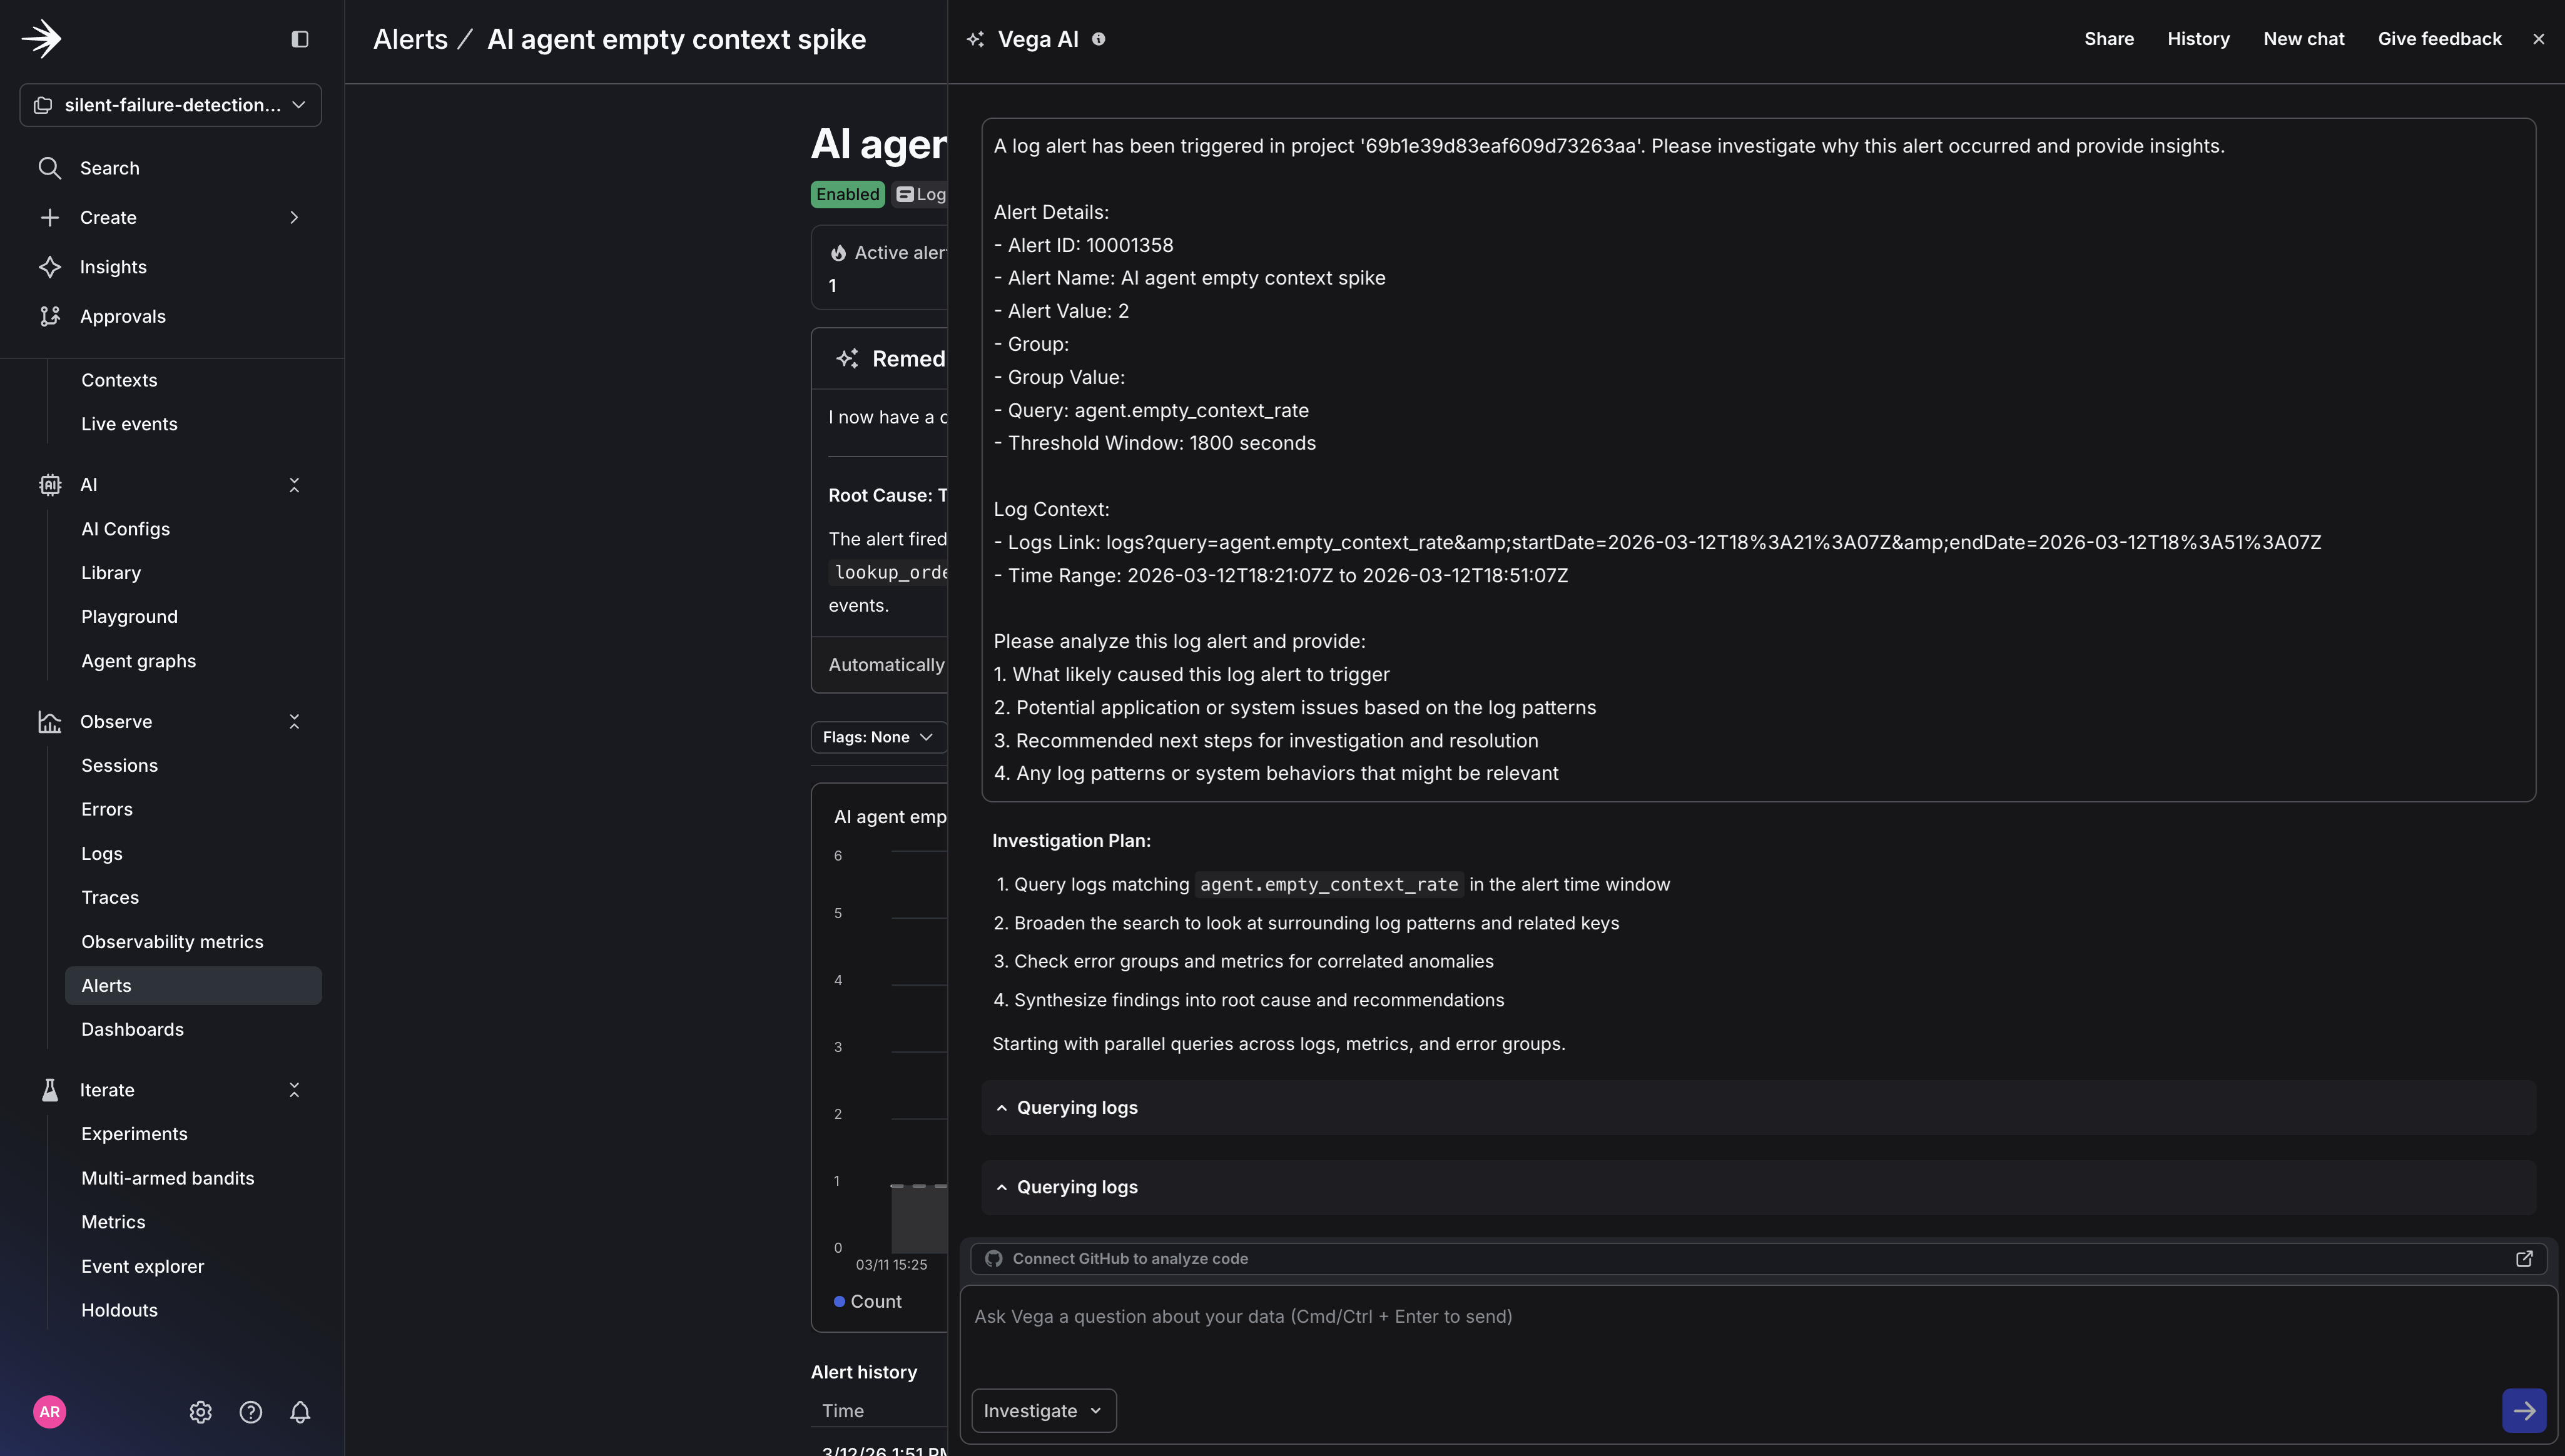
The report shows exactly what Vega examined: the log lines it read, the queries it ran, and how it connected the metric spike to the specific tool call pattern. Every data source is clickable, so you can verify Vega’s reasoning, run your own follow-up queries, or share the investigation link with your team.
You can also see how Vega incorporates telemetry data in its final report. It queries logs, traces, and metrics together to determine root cause, rather than leaving you to correlate those signals manually.
What just happened
You instrumented your agent with three signals (metrics, structured logs, and traces) and gave Vega an alert to watch. When the empty context rate spiked, Vega automatically correlated the metric with the tool call logs and traces, checked for recent flag changes or deployments, and delivered a root cause summary. No one had to open a dashboard or manually triage. Traditional alerting tells you something is wrong. Vega tells you why - and delivers the investigation to your Slack channel before you’ve even opened a dashboard.
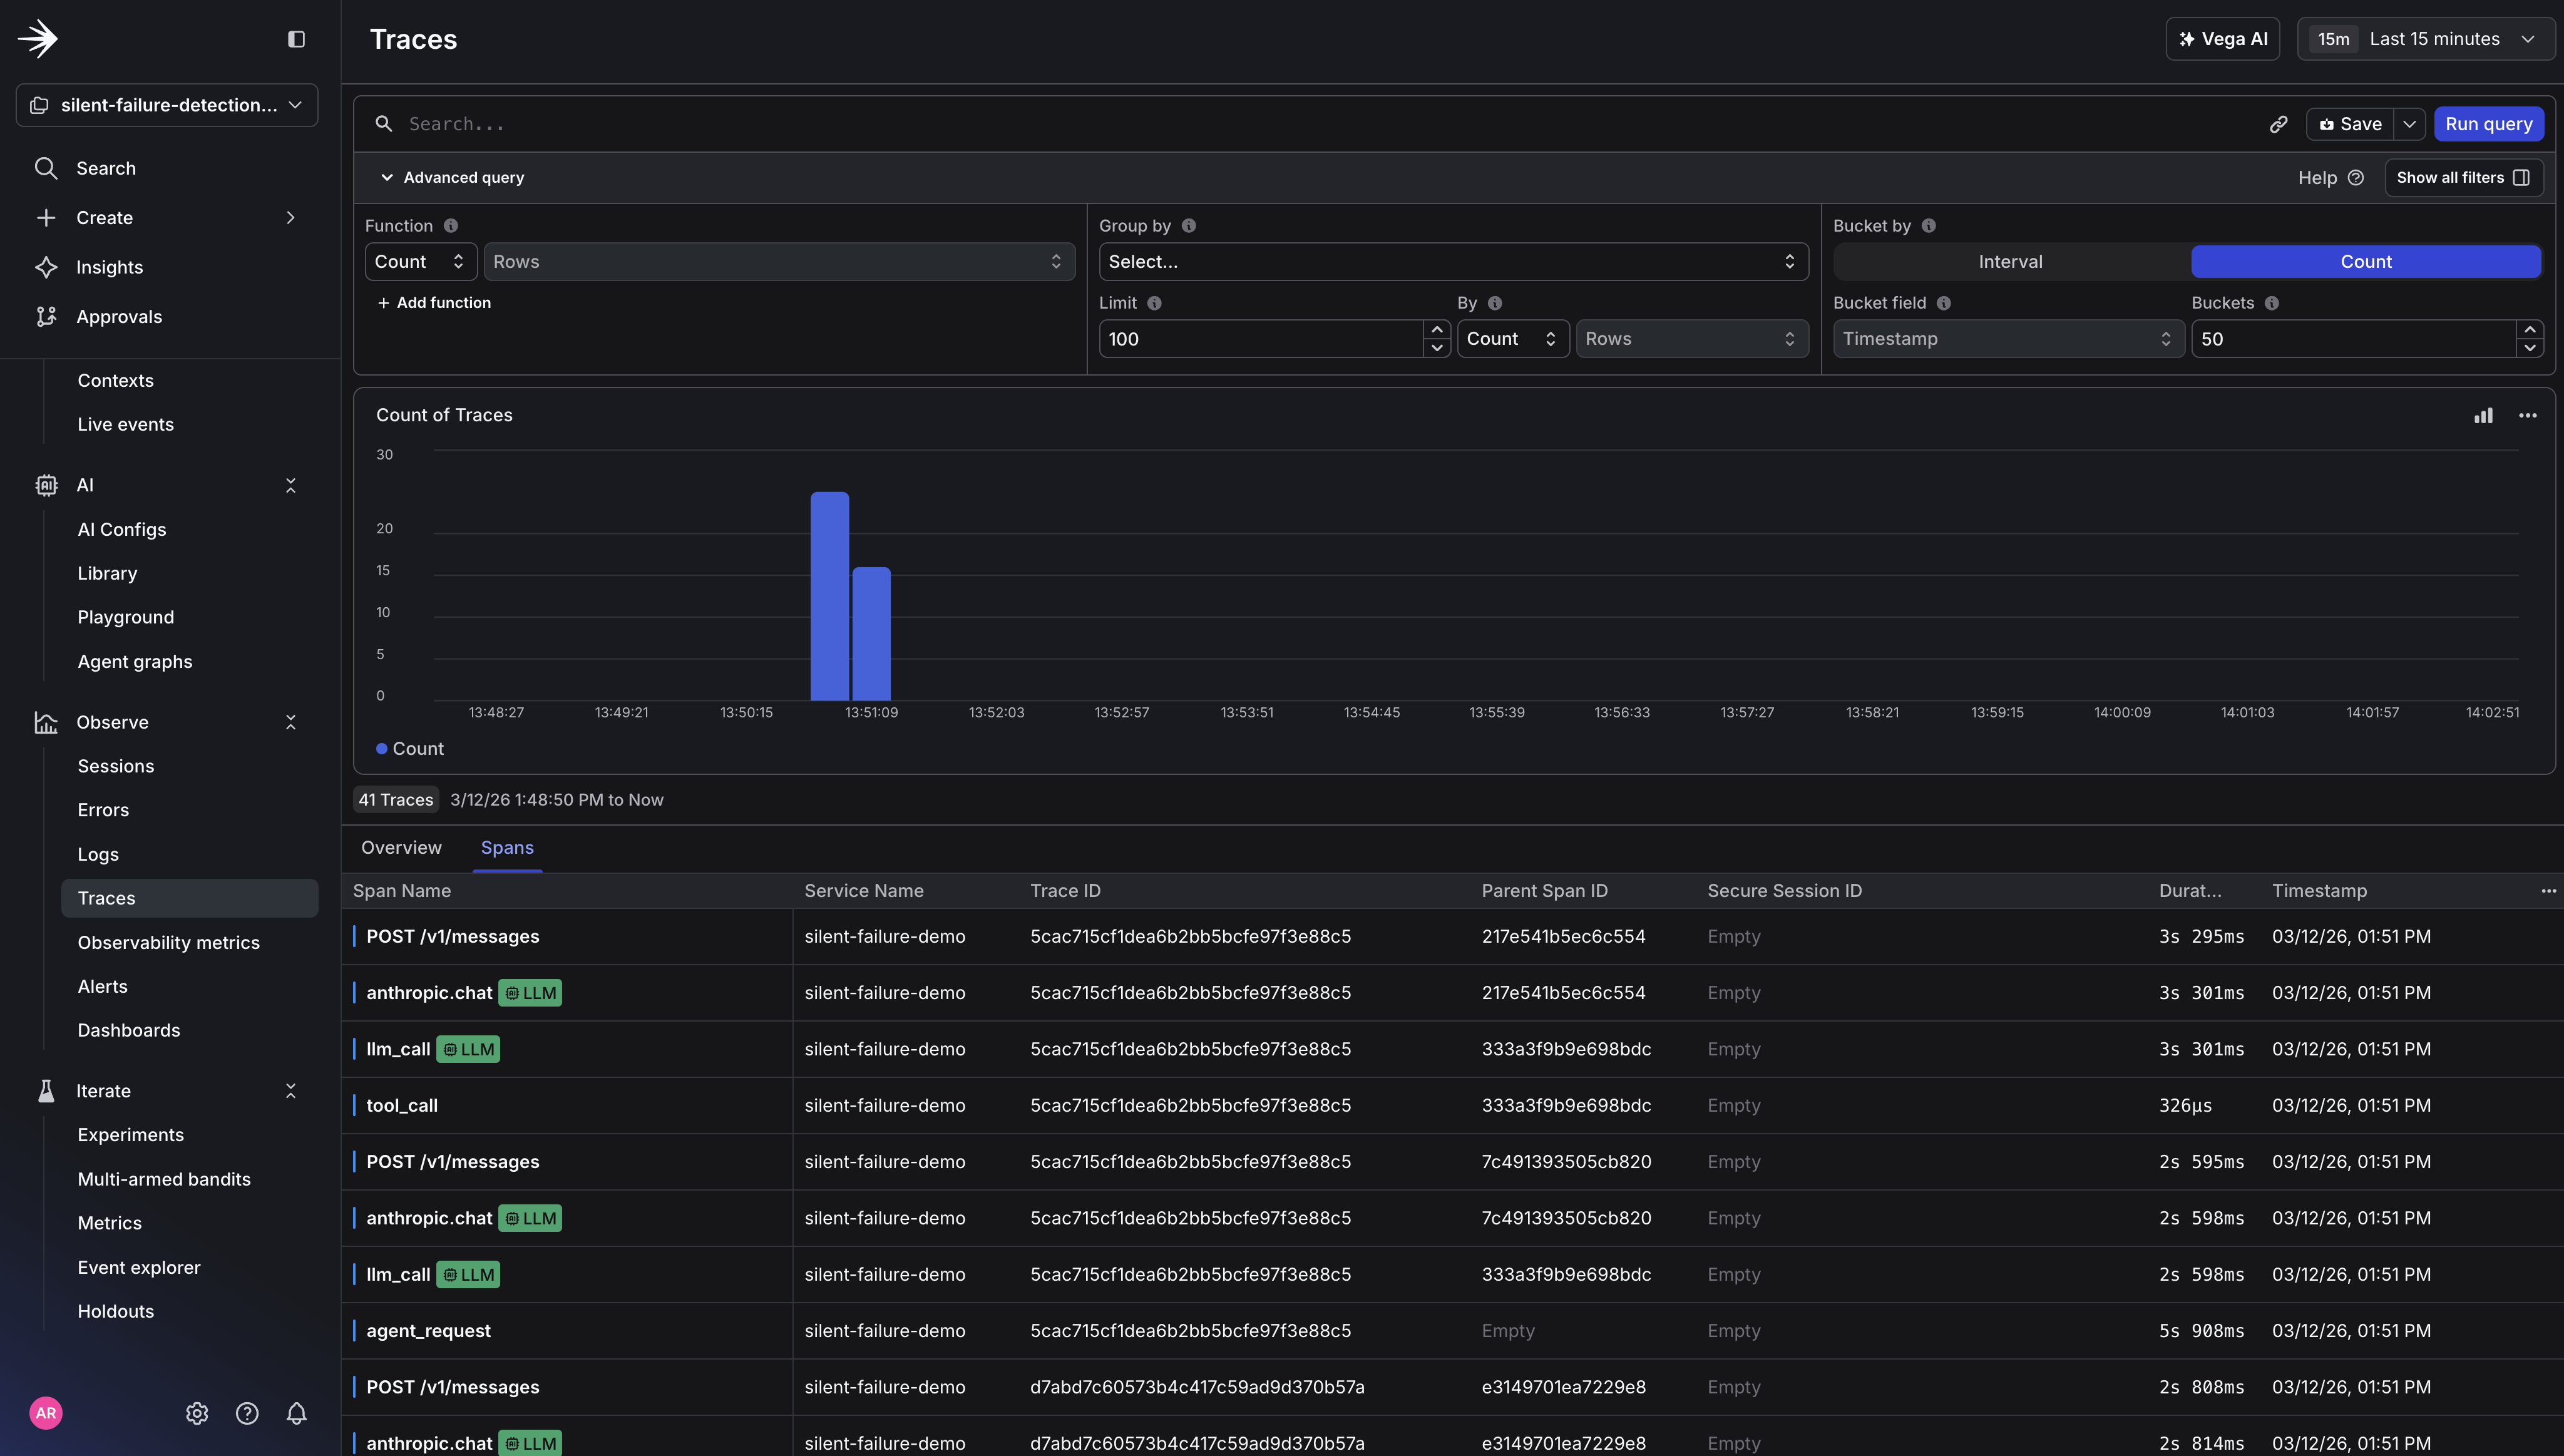
That’s the core loop: instrument the agent decision layer, set an alert with auto-remediation, and let Vega handle the investigation. The three signals work together. The metric triggers the alert, the logs tell Vega which tool calls failed and for which users, and the traces confirm the calls completed without errors , ruling out timeouts or exceptions as the cause. Here’s how the three signals work together:
Next steps
Add agent.fallback_response_rate to track when your agent generates responses without grounded context. Pairing it with agent.empty_context_rate gives Vega a causal chain to reason across. This is the difference between a vague “something is elevated” summary and a specific root cause.
- Switch to Agent mode and connect your GitHub repository under Settings → Vega → GitHub Integration. Once Vega has diagnosed the issue, it can propose a code fix and open a pull request.
- Go from detection to response with Adaptive Triggers (closed beta). Vega tells you why a metric spiked; Adaptive Triggers acts on it. Define a rule on a config so that when a metric breaches a threshold, the default variation switches to a pre-configured fallback automatically.
Ready to try Vega? Enable observability in your LaunchDarkly project and create your first alert with Vega Investigations enabled.