For AI agents: a documentation index is available at the root level at /llms.txt and /llms-full.txt. Append /llms.txt to any URL for a page-level index, or .md for the markdown version of any page.
Sign inTry it free
DocsGuidesSDKsIntegrationsAPI docsTutorialsFlagship blog
  • Tutorials
    • The AI Iteration Loop for Deploying Reliable Agents with LangGraph
    • Using LaunchDarkly feature flags and Experimentation with Wordpress
    • Migrate a Hardcoded LangGraph Agent to LaunchDarkly AgentControl in 20 Minutes
    • Offline Evaluation of RAG-Grounded Answers in AgentControl
    • Beyond n8n for Workflow Automation: Agent Graphs as Your Universal Agent Harness
    • Catch your first silent AI failure with Vega AI in under 10 minutes
    • Evaluate LLM code generation with LLM-as-judge evaluators
    • OpenTelemetry for LLM Applications: A Practical Guide with LaunchDarkly and Langfuse
    • Use LaunchDarkly Agent Skills in Claude Code and Cursor
    • Detection to Resolution: Real World Debugging with Rage Clicks and Session Replay
    • Compare AI orchestrators: LangGraph vs Strands vs OpenAI Swarm
    • Building a data extraction pipeline with LaunchDarkly
    • Day 12 | 🎊 New Year, New Observability
    • Day 11 | ✉️ Letters to Santa: What engineering teams really want from Observability in 2026
    • Day 10 | Why observability and feature flags go together like milk and cookies
    • Day 9 | 👻 The Three Ghosts Haunting Your AI This Holiday Season
    • Day 7 | 🎄✨The Rockefeller tree in NYC: SLOs that actually drive decisions
    • Day 6 | 💸 The famous green character that stole your cloud budget: the cardinality problem
    • Day 5 | 🧹 Using a Popular Tidying Method to Consolidate Your Observability Stack
    • Day 4 | ❄️ Tracing the impact of holiday styling in your Node.js app
    • Day 8 | 🎁 Observable Multi-Modal Agentic Systems
    • Day 3 | 🔔 Jingle All the Way to Zero-Config Observability
    • Day 2 | 🎅 He knows if you have been bad or good... But what if he gets it wrong?
    • Collecting user feedback in your app with feature flags
    • Day 1 | 🎄 Observability Under the Tree: What Changed in 2025
    • Build a User Frustration Detection & Response System
    • When to Add Online Evals to Your AgentControl
    • Detecting User Frustration: Understanding Rage Clicks and Session Replay
    • AgentControl config CI/CD Pipeline: Automated Quality Gates and Safe Deployment
    • A Deeper Look at LaunchDarkly Architecture: More than Feature Flags
    • Add Observability to Your React Native App in 5 minutes
    • Smart AI Agent Targeting with MCP Tools
    • Build a LangGraph Multi-Agent System in 20 Minutes with LaunchDarkly AgentControl
    • Snowflake Cortex Completion API + LaunchDarkly SDK Integration
    • Using AgentControl to review database changes
    • How to implement WebSockets and kill switches in a Python application
    • 4 hacks to turbocharge your Cursor productivity
    • Create a feature flag in your IDE in 5 minutes with LaunchDarkly's MCP server
    • Observability for Your Go ORM: OpenTelemetry Integration with GORM
    • The complete guide to OpenTelemetry in Next.js
    • How to instrument your React Native app with OpenTelemetry
    • The complete guide to OpenTelemetry in Python
    • Monitoring Browser Applications with OpenTelemetry
    • How to Use OpenTelemetry to Monitor Next.js Applications
    • What is OpenTelemetry and Why Should I Care?
    • Distributed Tracing in Next.js Apps
    • Tracing Distributed Systems in Next.js
    • Real-time Monitoring in Django: Essential Tools and Techniques
    • DeepSeek vs Qwen: local model showdown featuring LaunchDarkly AgentControl
    • Application Tracing in .NET for Performance Monitoring
    • The Ultimate Guide to Ruby Logging: Best Libraries and Practices
    • Using Materialized Views in ClickHouse (vs. Postgres)
    • Filtering and Sampling LaunchDarkly Ingest
    • How to Set Up Your Production AWS MSK Kafka Cluster
    • Publishing an NPM Package with Private pnpm Monorepo Dependencies
    • How To Use The Chrome Inspector & Debugger
    • 3 Levels of Data Validation in a Full Stack Application With React
    • The power of the monorepo: Keep your fullstack app in sync!
    • Compression: The simple, powerful upgrade for your web stack
    • Video tutorials
Sign inTry it free
LogoLogo
On this page
  • Setting Up OpenTelemetry for Next.js: Tracing, Logging, and Metrics
  • Installing OpenTelemetry in Next.js
  • Setting Up the OpenTelemetry SDK
  • Configuring Tracing
  • Logging in OpenTelemetry
  • Capturing Exceptions with Spans
  • Exporting Metrics
  • Putting it all together
  • Conclusion
Tutorials

The complete guide to OpenTelemetry in Next.js

Was this page helpful?
Previous

How to instrument your React Native app with OpenTelemetry

Next
Built with

Published February 10, 2025

portrait of Vadim Korolik.

by Vadim Korolik

1LaunchDarkly is an [open source](https://github.com/highlight/highlight) monitoring platform. Check out [LaunchDarkly](https://launchdarkly.com) if you’re interested in learning more.

OpenTelemetry is an important specification that defines how we send telemetry data to observability backends like LaunchDarkly, Grafana, and others. OpenTelemetry is great because it is vendor agnostic, and can be used with several observability backends. If you’re new to OpenTelemetry, you can learn more about it here.

This complete guide to OpenTelemetry in Next.js covers high-level concepts as well as how to send traces, logs, and metrics to your OpenTelemetry backend of choice.

Setting Up OpenTelemetry for Next.js: Tracing, Logging, and Metrics

Let’s walk through setting up OpenTelemetry in a Next.js project, covering:

  • Tracing: Capturing distributed traces for API requests and page transitions
  • Logging: Collecting structured logs that correlate with traces
  • Metrics: Exporting performance and custom application metrics

There are several reasons that make OTel a great choice for monitoring your Next.js application:

  • Built-in Spans: Next.js provides automatic spans at the framework level
  • Exception Tracking: Errors are automatically captured within traces by the framework
  • Simplified Setup: @vercel/otel eliminates the need to manually configure OpenTelemetry SDKs, exporters, and instrumentations

By the end of this tutorial, you’ll have all the observability data you need to be proactively notified when something goes wrong, troubleshoot issues quickly, and fix performance bottlenecks in the critical parts of your code.

Installing OpenTelemetry in Next.js

We’ve covered instrumenting Next.js with @vercel/otel in our blog post on using @vercel/otel in Next.js. While @vercel/otel is a simpler option for many applications, it may not give you full control over the OpenTelemetry SDKs. Today, we’ll go through a complete guide to setting up OpenTelemetry from scratch, explaining the configuration options along the way.

1Our implementation covers setting up @opentelemetry/sdk-node which is only compatible with the Node.js runtime.
2If you are using the Edge runtime in Next.js, you'll need to use @vercel/otel which conditionally switches to the
3@opentelemetry/sdk-trace-web implementation which is Edge runtime compatible, or implement a similar approach yourself.`

To get started, install the necessary OpenTelemetry dependencies:

$yarn add @opentelemetry/api @opentelemetry/api-logs @opentelemetry/sdk-node \
> @opentelemetry/instrumentation-http @opentelemetry/instrumentation-fetch \
> @opentelemetry/exporter-trace-otlp-grpc @opentelemetry/exporter-logs-otlp-grpc \
> @opentelemetry/exporter-metrics-otlp-grpc @opentelemetry/resources @opentelemetry/semantic-conventions

This setup includes the core OpenTelemetry API, SDK, HTTP and Fetch instrumentations, and OTLP exporters for traces and metrics.

Setting Up the OpenTelemetry SDK

Create a new file otel.ts at the root of your Next.js project:

1import { NodeSDK } from '@opentelemetry/sdk-node';
2import { ConsoleSpanExporter } from '@opentelemetry/sdk-trace-base';
3import { OTLPTraceExporter } from '@opentelemetry/exporter-trace-otlp-grpc';
4import { OTLPMetricExporter } from '@opentelemetry/exporter-metrics-otlp-grpc';
5import { Resource } from '@opentelemetry/resources';
6import { SEMRESOURCENAME } from '@opentelemetry/semantic-conventions';
7import { HttpInstrumentation } from '@opentelemetry/instrumentation-http';
8import { FetchInstrumentation } from '@opentelemetry/instrumentation-fetch';
9import { AlwaysOnSampler } from '@opentelemetry/sdk-trace-base';
10import { BatchSpanProcessor } from '@opentelemetry/sdk-trace-base';
11import { BatchLogRecordProcessor } from '@opentelemetry/sdk-logs';
12import { PeriodicExportingMetricReader } from '@opentelemetry/sdk-metrics';
13
14const exporter = new OTLPTraceExporter(config)
15const spanProcessor = new BatchSpanProcessor(exporter, opts)
16
17const logsExporter = new OTLPLogExporter(config)
18const logProcessor = new BatchLogRecordProcessor(logsExporter, opts)
19
20const metricsExporter = new OTLPMetricExporter(config)
21const metricsReader = new PeriodicExportingMetricReader({exporter: metricsExporter})
22
23// Configure the OTLP exporter to send data to your OpenTelemetry backend
24const config = { url: 'https://otel.highlight.io:4317' }
25const sdk = new NodeSDK({
26 autoDetectResources: true,
27 resourceDetectors: [processDetectorSync],
28 resource: new Resource({
29 [SEMRESOURCENAME.SERVICE_NAME]: 'nextjs-app',
30 'highlight.project_id': '<YOUR_PROJECT_ID>',
31 }),
32 spanProcessors: [spanProcessor],
33 logRecordProcessors: [logProcessor],
34 metricReader: metricReader,
35 traceExporter: exporter,
36 contextManager: new AsyncLocalStorageContextManager(),
37 sampler: new AlwaysOnSampler(),
38 instrumentations: [new HttpInstrumentation(), new FetchInstrumentation()],
39})
40
41sdk.start();
42console.log('OpenTelemetry initialized');

To trigger this file to run when the app starts, you can invoke it from the Next.js magic instrumentation.ts file.

1export function register() {
2 await import('./otel');
3}

The instrumentation.ts file is automatically detected by Next.js and will run when the app starts. Before Next.js 15, the instrumentation is experimental, so you will have to enable it explicitly:

1module.exports = {
2 experimental: {
3 instrumentationHook: true,
4 },
5};

Configuring Tracing

With the SDK configured, your application will start to export the telemetry data using the exporters defined. However, you may wonder what data is being captured without any explicit code added.

Next.js has built-in OpenTelemetry spans for various parts of the application, including:

  • API routes (pages/api or app/api)
  • Page router (Pages Directory)
  • App router (App Directory)

Some top-level spans are emitted out-of-the-box, while others can be turned on by turning on verbose logging:

$NEXT_OTEL_VERBOSE=1

Setting the NEXT_OTEL_VERBOSE environment variable will emit additional traces that give you more granularity of the code execution.

For example, here’s a flame graph visualization of a trace without verbose tracing, NEXT_OTEL_VERBOSE=0:
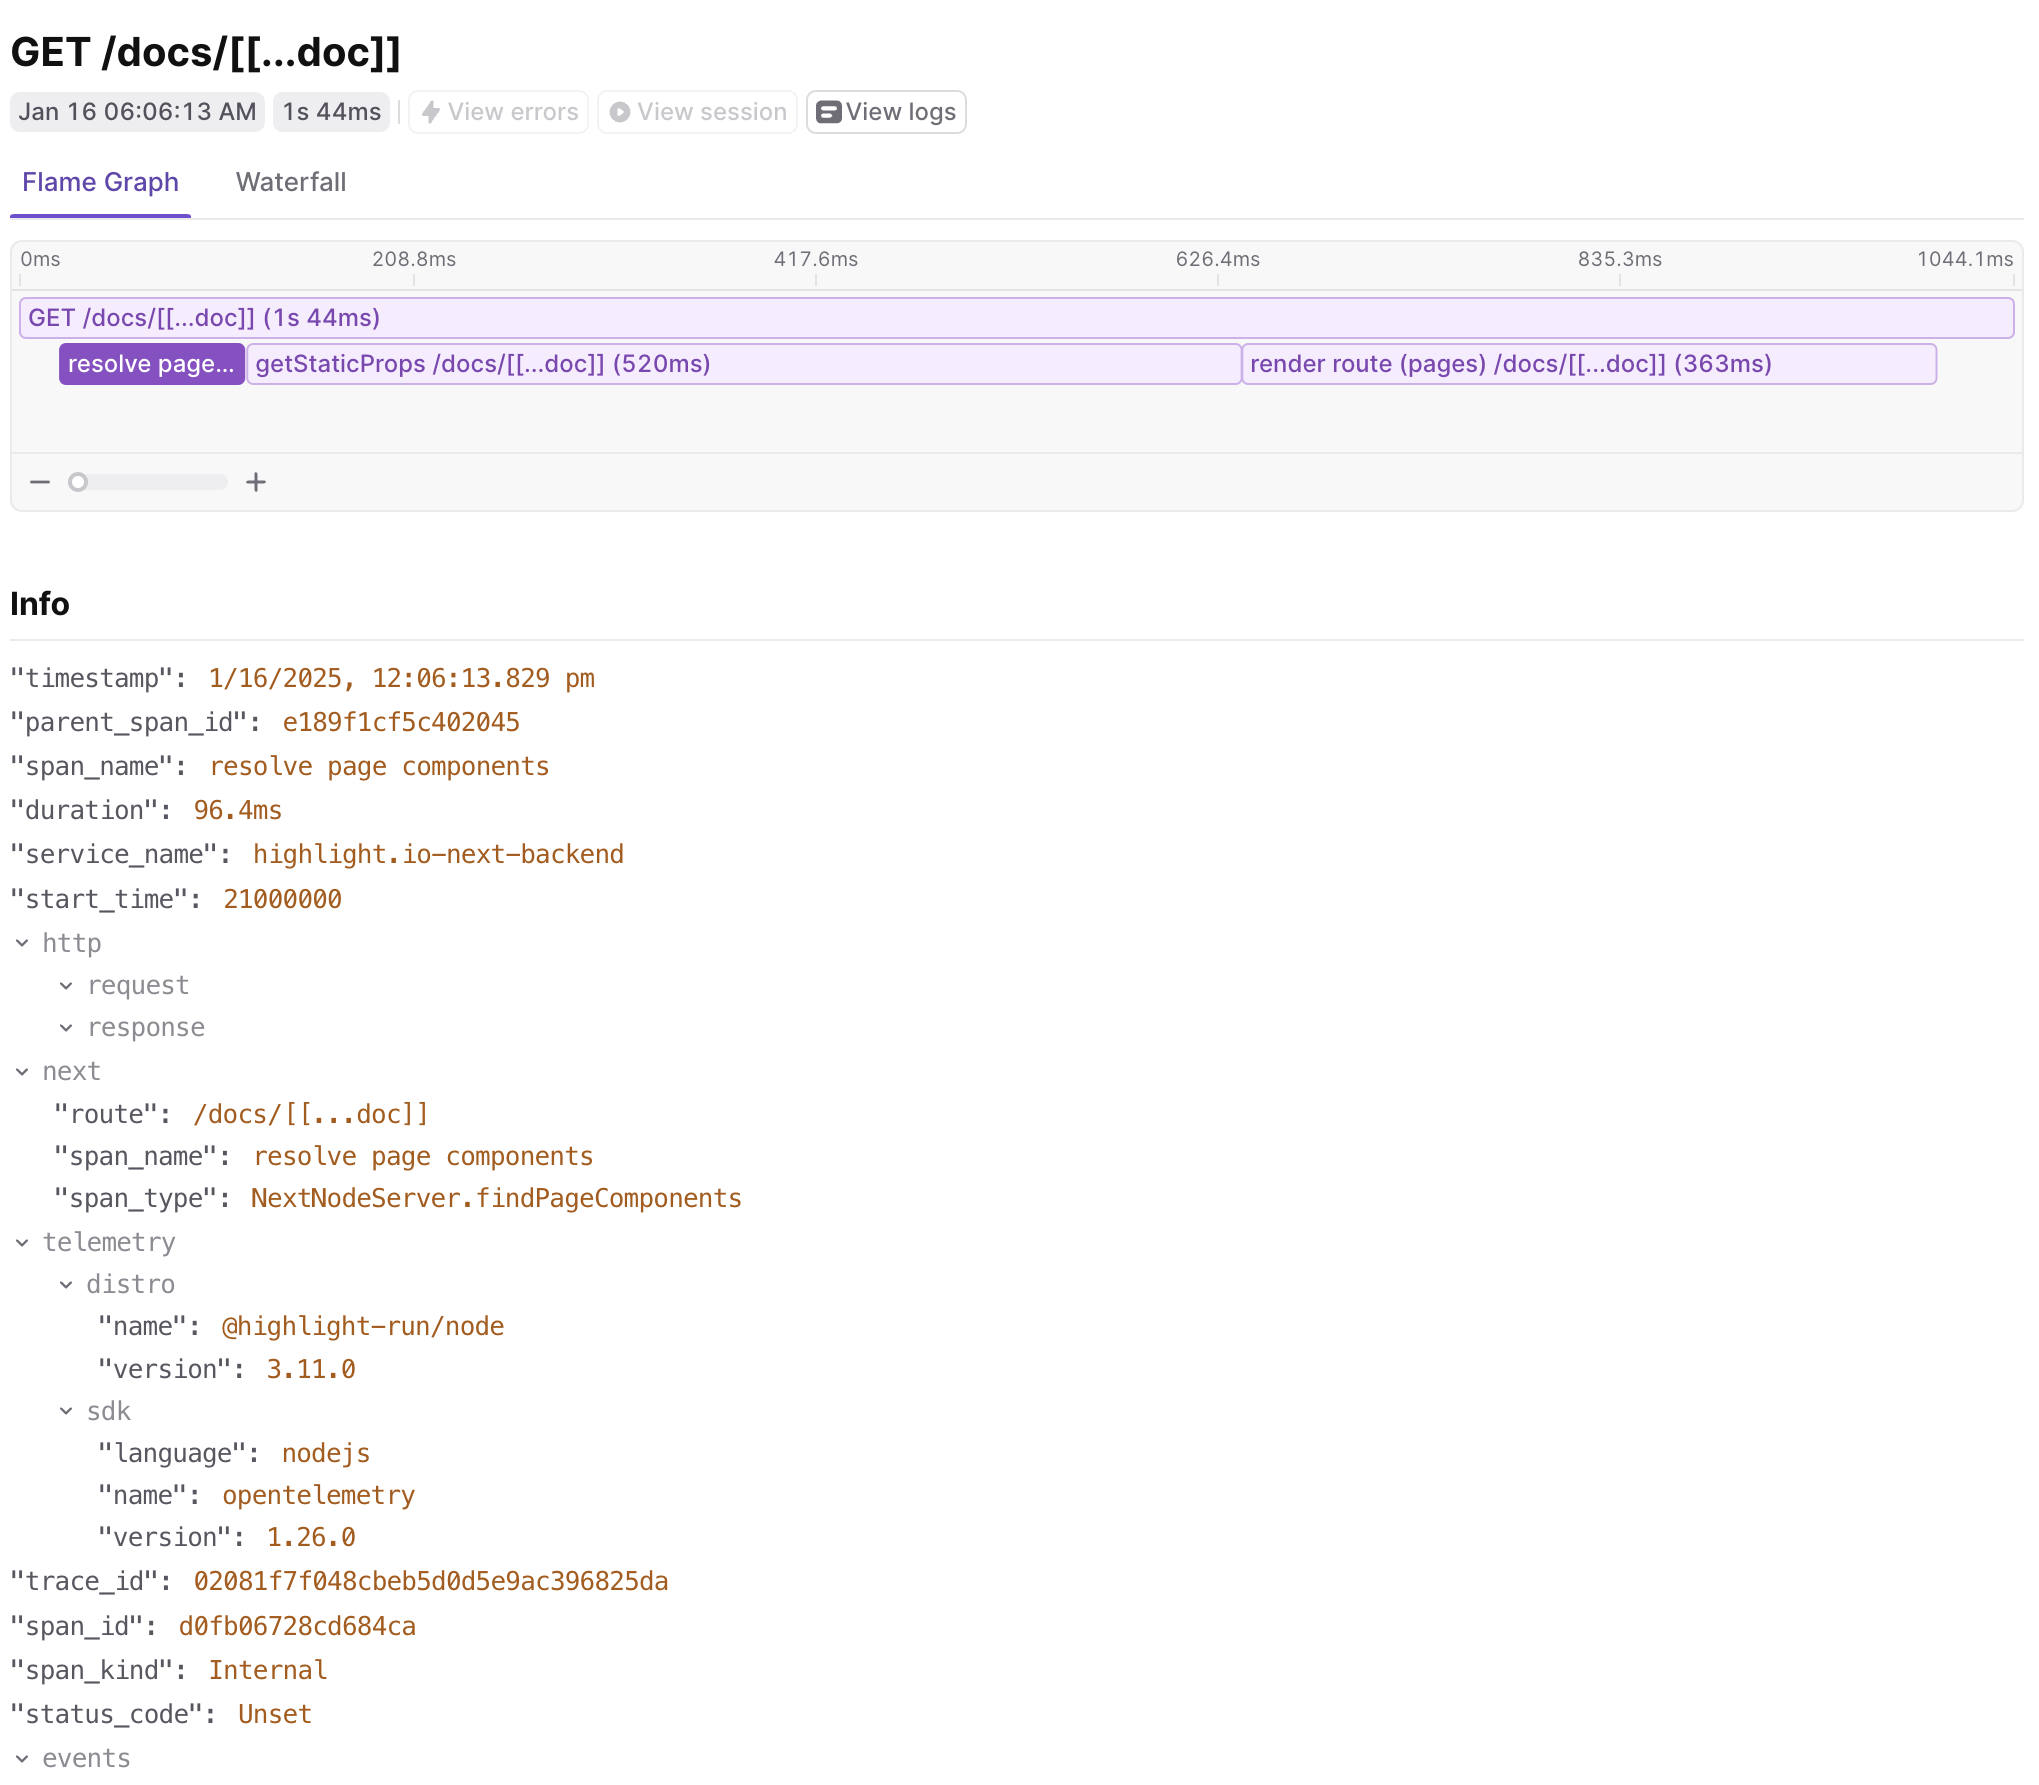
Flame graph visualization of a Next.js trace without verbose tracing enabled.

Flame graph visualization of a Next.js trace without verbose tracing enabled.

And here’s the same trace with verbose tracing enabled, NEXT_OTEL_VERBOSE=1:
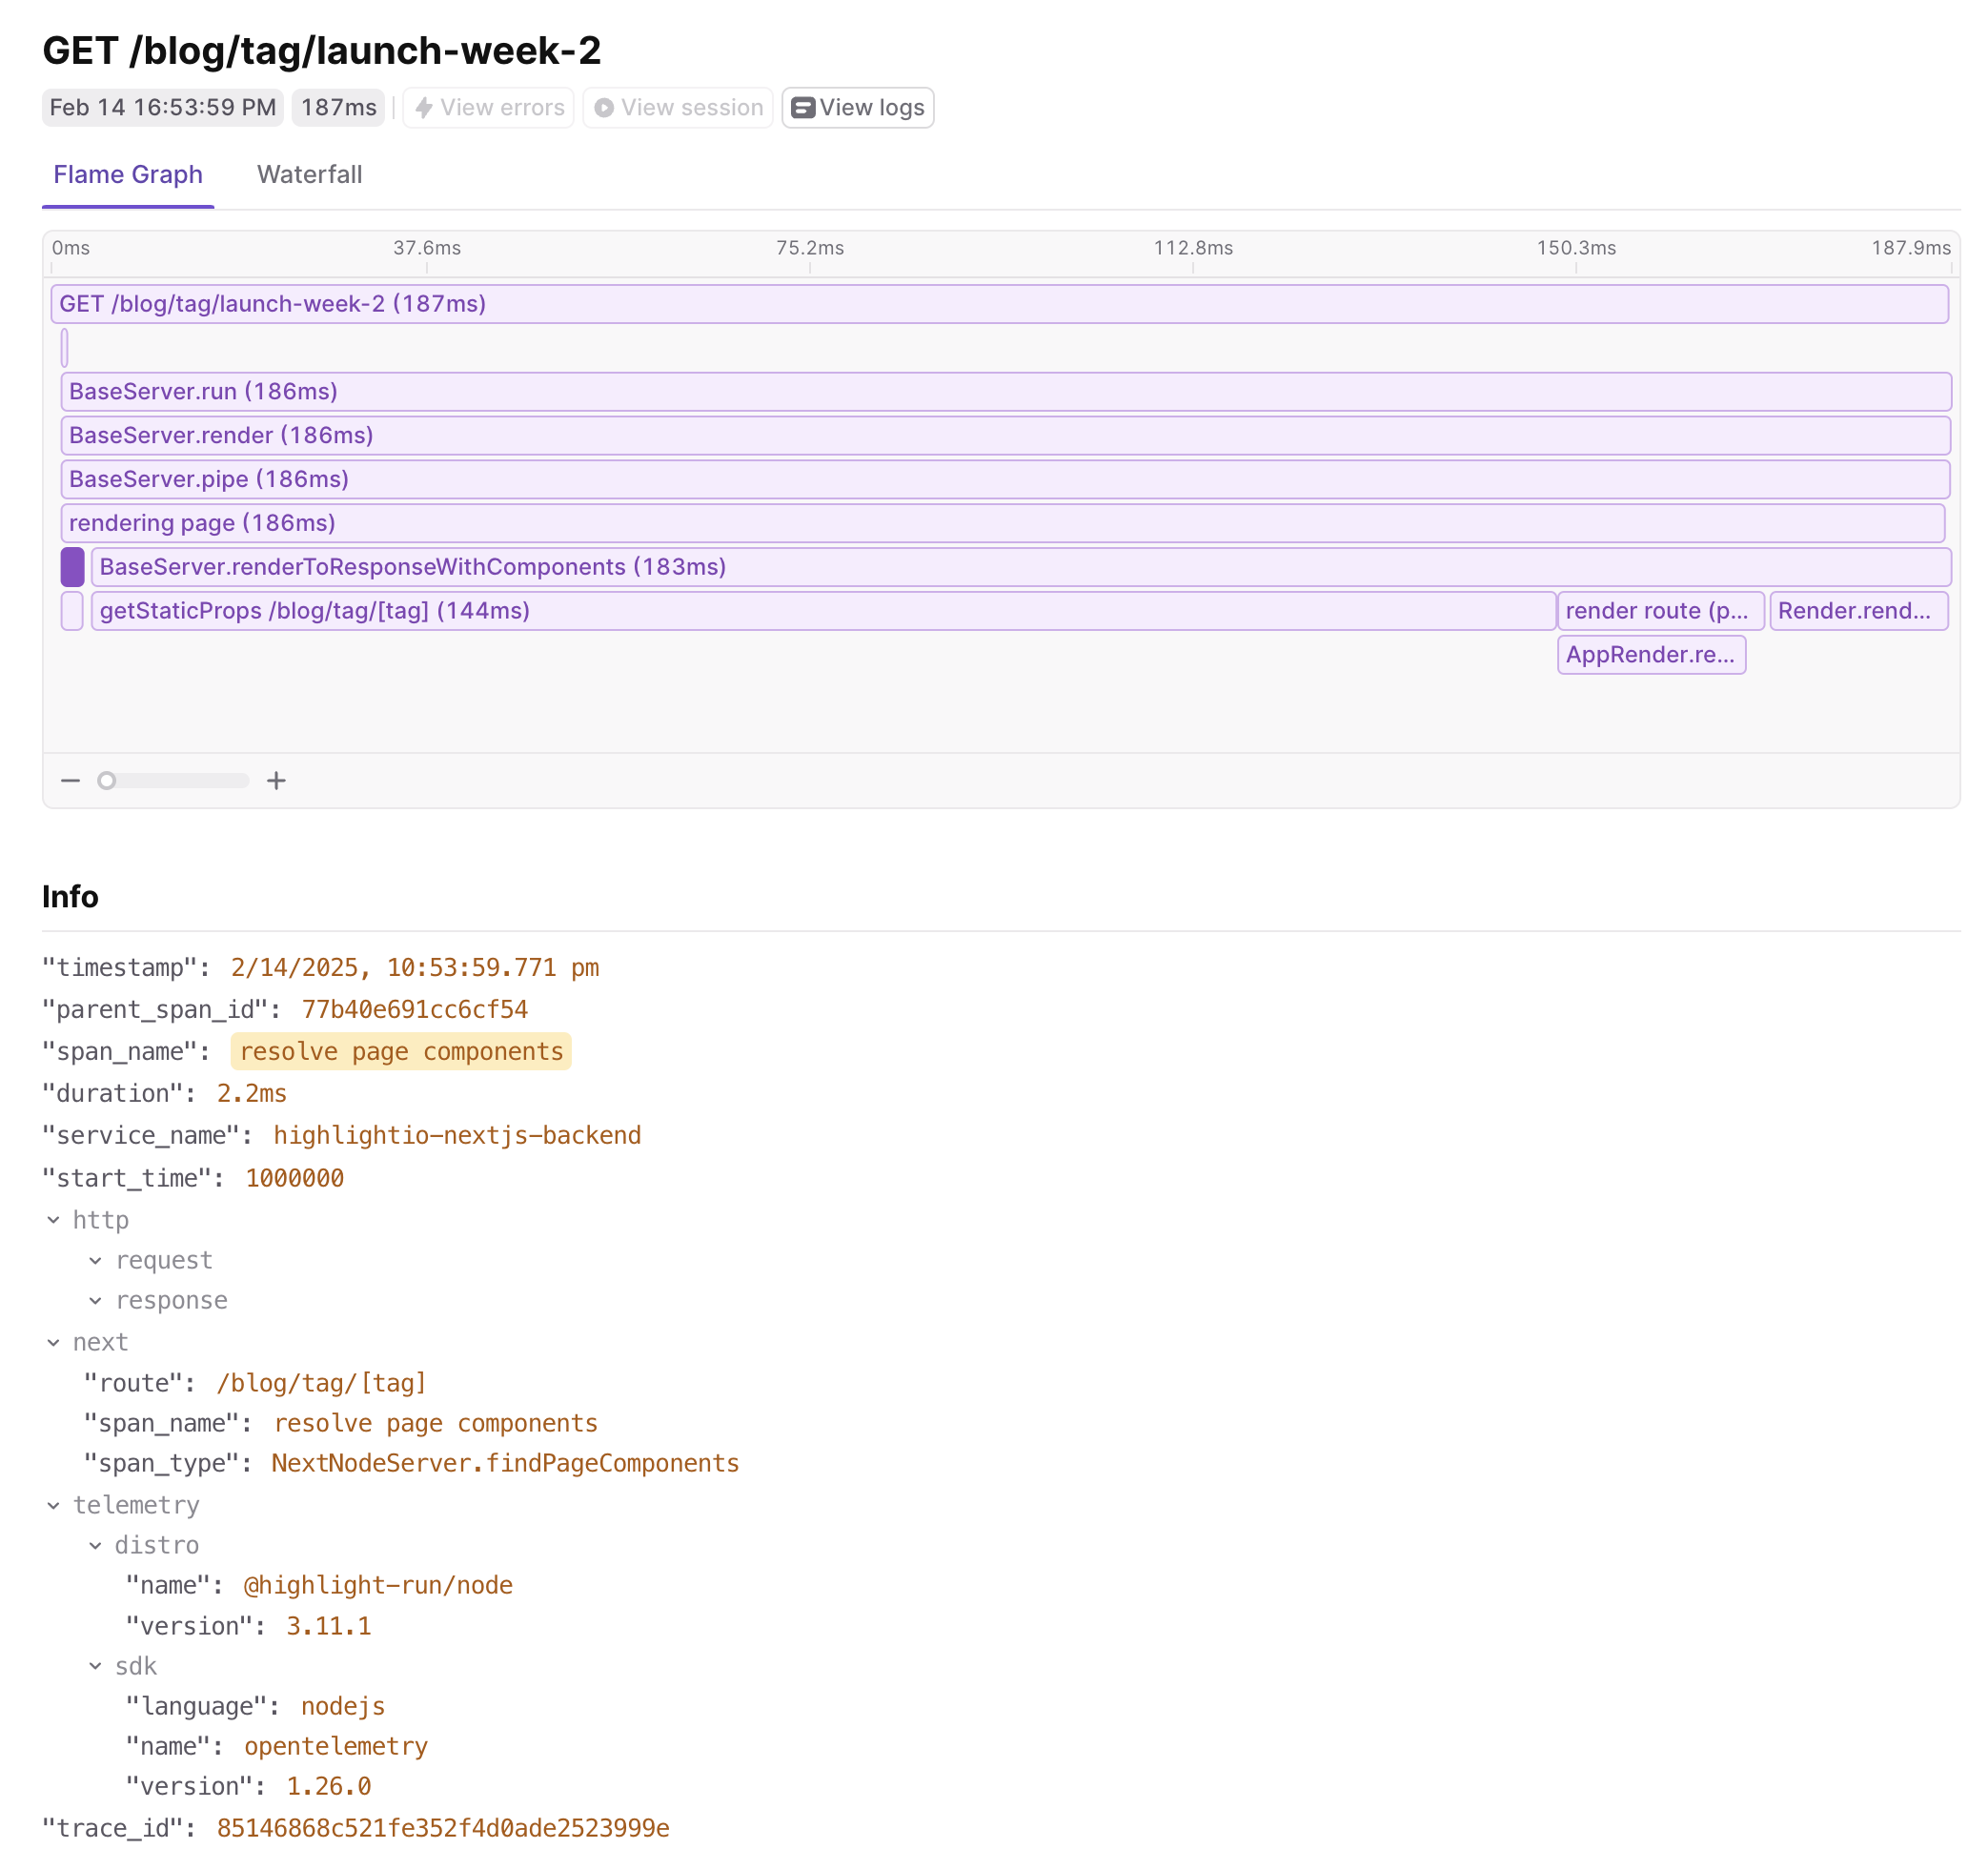
Flame graph visualization of the same Next.js trace with verbose tracing enabled showing additional spans.

Flame graph visualization of the same Next.js trace with verbose tracing enabled showing additional spans.

Let’s go through some examples of the data that can be captured.
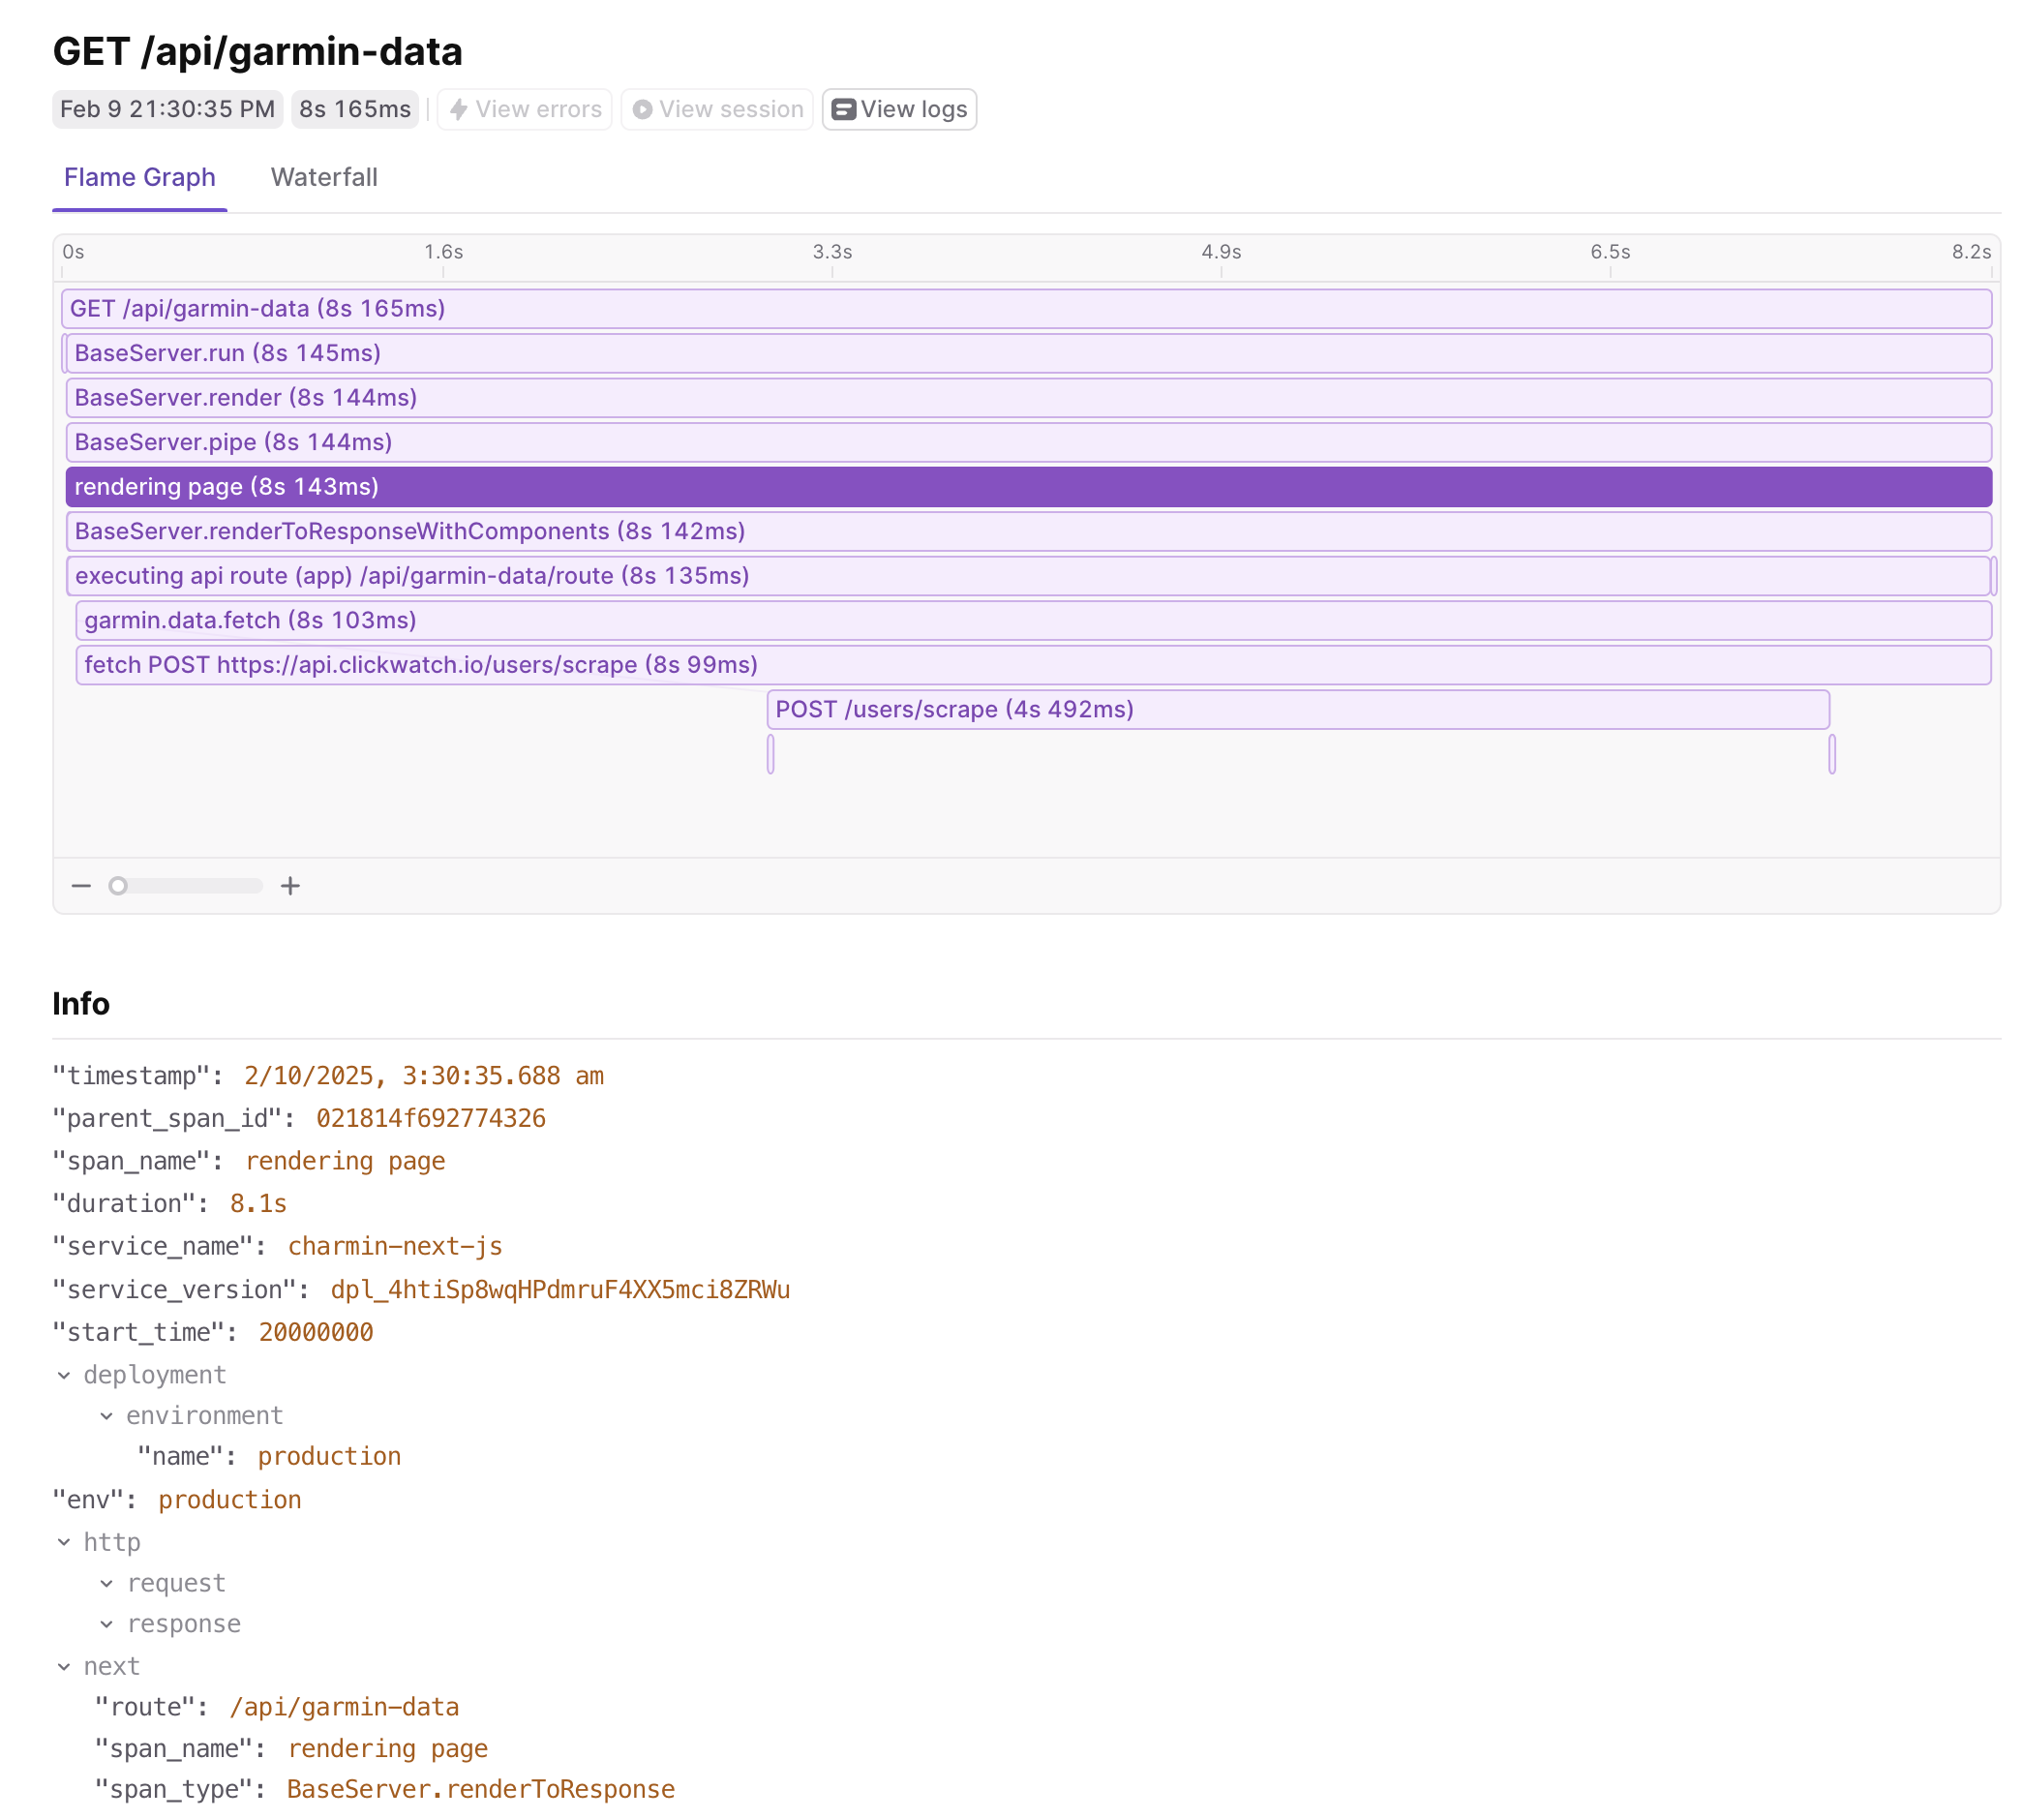
Trace view showing an API route request piped through Next.js with a custom span wrapping an outgoing fetch call.

Trace view showing an API route request piped through Next.js with a custom span wrapping an outgoing fetch call.

In the image above, you can see the trace start with an api route request that is piped through Next.js to the API handler. We also see a custom span that wraps an outgoing API request to another service. Because we set up auto-instrumentation, we capture the fetch call automatically, and can even propagate the trace context to the backend service.

Here’s a list of the top-level spans that are captured automatically by Next.js:

  • BaseServer.handleRequest - Named [http.method] [next.route], the root span for each incoming request to your Next.js application.
  • AppRender.getBodyResult - Named render route (app) [next.route], represents the process of rendering a route in the app router.
  • AppRender.fetch - Named fetch [http.method] [http.url], represents the fetch request executed in your code.
  • AppRouteRouteHandlers.runHandler - Named executing api route (app) [next.route], represents the execution of an API Route Handler in the app router.
  • Render.getServerSideProps - Named getServerSideProps [next.route], represents the execution of getServerSideProps for a specific route.
  • Render.getStaticProps - Named getStaticProps [next.route], represents the execution of getStaticProps for a specific route.
  • Render.renderDocument - Named render route (pages) [next.route], represents the process of rendering the document for a specific route.
  • ResolveMetadata.generateMetadata - Named generateMetadata [next.page], represents the process of generating metadata for a specific route.
  • NextNodeServer.findPageComponents - Named resolve page components, represents the process of resolving page components for a specific page.
  • NextNodeServer.getLayoutOrPageModule - Named resolve segment modules, represents loading of code modules for a layout or a page.
  • NextNodeServer.startResponse - Named start response, represents the process of starting the response for a specific route.

See the Next.js docs for more details.

Whether you have an API route, a page route, or an app route, you’ll see a span for each request. Spans will carry details such as what route was requested, how long each step of the processing took, and what metadata was provided in the HTTP request.

The power lies in connecting the automatic spans with custom ones and ones provided by additional OpenTelemetry instrumentations. As shown in the image above, when the app route api method makes an outgoing HTTP request to another service (in this case, an example Python service), the trace will capture the duration of the backend API request and the response status code. At a glance, that can help diagnose a performance issue due to a downstream service or a failed backend API call.

Logging in OpenTelemetry

Let’s add some more logic to otel.ts to create a logger that can be used to emit custom messages.

1import { LoggerProvider } from '@opentelemetry/sdk-logs';
2
3const loggerProvider = new LoggerProvider();
4const logger = loggerProvider.getLogger('nextjs-logger');
5
6logger.emit({
7 severityText: 'INFO',
8 body: 'Application started',
9});

You can use this logger in your code or with a helper method. Make sure to check out other OpenTelemetry logging instrumentations that can automatically hook into common logging libraries like Winston or Pino.

If you want to capture console logger methods such as console.log, console.error, etc., you’ll need to manually instrument them to record their logs to the OpenTelemetry logger. Here’s an example of how to do that:

1import { LoggerProvider } from '@opentelemetry/sdk-logs';
2
3const loggerProvider = new LoggerProvider();
4const logger = loggerProvider.getLogger('nextjs-logger');
5
6const originalConsoleLog = console.log;
7console.log = (...args) => {
8 originalConsoleLog(...args);
9 logger.emit({
10 severityText: 'INFO',
11 body: args.join(' '),
12 });
13};
14
15console.log('Hello, world!');

Capturing Exceptions with Spans

Let’s emit a custom span in our code that can be used to capture an exception. We’ll start a span and then automatically add error attributes by capturing the error. Modify your API route:

1import { trace } from '@opentelemetry/api';
2
3const tracerProvider = trace.getTracerProvider();
4const tracer = tracerProvider.getTracer("tracer");
5
6export default async function handler(req, res) {
7 await tracer.startActiveSpan(
8 "data.fetch",
9 {
10 attributes: {
11 "user.email": email || undefined,
12 "user.name": name || undefined,
13 },
14 },
15 async (span) => {
16 try {
17 doSomething();
18 throw new Error('Something went wrong!');
19 } catch (error) {
20 if (span) {
21 span.recordException(error);
22 }
23 }
24 },
25 );
26}

This ensures that the error is captured within the OpenTelemetry trace and can be visualized in your tracing backend.

Next.js 15 also introduces a new onRequestError hook that can be used to capture server errors. You can use it in your instrumentation.ts file to intercept all server actions and capture the error:

1import { type Instrumentation } from 'next'
2
3export const onRequestError: Instrumentation.onRequestError = async (
4 err,
5 request,
6 context
7) => {
8 const { trace } = await import('@opentelemetry/api')
9 const span = trace.getActiveSpan()
10 if (span) {
11 span.setAttributes({
12 'http.url': request.path,
13 'http.method': request.method,
14 'next.router.kind': context.routerKind,
15 'next.router.path': context.routerPath,
16 'next.router.type': context.routerType,
17 'next.render.source': context.renderSource,
18 'next.render.type': context.renderType,
19 'next.revalidate.reason': context.revalidateReason,
20 })
21 span.recordException(err)
22 }
23}

This example reports the error to the current active span, which is the span for the request.

Exporting Metrics

Next.js applications often benefit from metrics like request count, latency, and errors. Here’s how to add instrumentation for request tracking in otel.ts:

1import { MeterProvider } from '@opentelemetry/sdk-metrics';
2
3const meter = new MeterProvider().getMeter('nextjs-meter');
4const requestCounter = meter.createCounter('http_requests_total', {
5 description: 'Counts total HTTP requests',
6});
7
8export function trackRequest() {
9 requestCounter.add(1);
10}

Then, use it in an API route:

1import { trackRequest } from '../../otel';
2
3export default function handler(req, res) {
4 trackRequest();
5 res.status(200).json({ message: 'Metrics tracked!' });
6}

Putting it all together

Let’s put all of the pieces together and create a complete otel.ts file that will automatically instrument your Next.js app. Using @vercel/otel, we’ll configure export for LaunchDarkly, but you can use any other OpenTelemetry-compatible backend:

1import { NodeSDK } from '@opentelemetry/sdk-node';
2import { ConsoleSpanExporter } from '@opentelemetry/sdk-trace-base';
3import { OTLPTraceExporter } from '@opentelemetry/exporter-trace-otlp-grpc';
4import { OTLPMetricExporter } from '@opentelemetry/exporter-metrics-otlp-grpc';
5import { Resource } from '@opentelemetry/resources';
6import { SEMRESOURCENAME } from '@opentelemetry/semantic-conventions';
7import { HttpInstrumentation } from '@opentelemetry/instrumentation-http';
8import { FetchInstrumentation } from '@opentelemetry/instrumentation-fetch';
9import { AlwaysOnSampler } from '@opentelemetry/sdk-trace-base';
10import { BatchSpanProcessor } from '@opentelemetry/sdk-trace-base';
11import { BatchLogRecordProcessor } from '@opentelemetry/sdk-logs';
12import { PeriodicExportingMetricReader } from '@opentelemetry/sdk-metrics';
13
14const exporter = new OTLPTraceExporter(config)
15const spanProcessor = new BatchSpanProcessor(exporter, opts)
16
17const logsExporter = new OTLPLogExporter(config)
18const logProcessor = new BatchLogRecordProcessor(logsExporter, opts)
19
20const metricsExporter = new OTLPMetricExporter(config)
21const metricsReader = new PeriodicExportingMetricReader({exporter: metricsExporter})
22
23// Configure the OTLP exporter to send data to your OpenTelemetry backend
24const config = { url: 'https://otel.highlight.io:4317' }
25const sdk = new NodeSDK({
26 autoDetectResources: true,
27 resourceDetectors: [processDetectorSync],
28 resource: new Resource({
29 [SEMRESOURCENAME.SERVICE_NAME]: 'nextjs-app',
30 'highlight.project_id': '<YOUR_PROJECT_ID>',
31 }),
32 spanProcessors: [spanProcessor],
33 logRecordProcessors: [logProcessor],
34 metricReader: metricReader,
35 traceExporter: exporter,
36 contextManager: new AsyncLocalStorageContextManager(),
37 sampler: new AlwaysOnSampler(),
38 instrumentations: [new HttpInstrumentation(), new FetchInstrumentation()],
39})
40
41sdk.start();

Now, let’s use the OpenTelemetry SDK in our route to emit data:

1import {NextResponse} from "next/server";
2import api, {propagation} from "@opentelemetry/api";
3import {logs, SeverityNumber} from "@opentelemetry/api-logs";
4
5const tracerProvider = api.trace.getTracerProvider();
6const tracer = tracerProvider.getTracer("data");
7
8const loggerProvider = logs.getLoggerProvider();
9const logger = provider.getLogger("data");
10
11const meterProvider = api.metrics.getMeterProvider();
12const meter = meterProvider.getMeter("data");
13
14// This is an example implementation of a route that fetches data from a Python service
15export async function GET() {
16 const {email, name} = req.query;
17
18 console.log("Fetching data...", {email});
19 const headers = {
20 "Content-Type": "application/json",
21 };
22 propagation.inject(api.context.active(), headers);
23 const response = await fetch(
24 `https://api.sampleapis.com/coffee/hot`,
25 {
26 method: "POST",
27 headers,
28 body: JSON.stringify({
29 email,
30 }),
31 },
32 );
33 if (!response.ok) {
34 throw new Error("Failed to fetch data");
35 }
36 const data = await response.json();
37
38 // create a span for data processing that may be complex
39 const processed = await tracer.startActiveSpan(
40 "data.process",
41 {
42 attributes: {
43 "user.email": email || undefined,
44 "user.name": name || undefined,
45 },
46 },
47 async () => {
48 // do something that may be slow
49 data.map((d) => ({
50 ...d,
51 calculated: d.value ?? 0 * 1.23
52 }))
53 });
54
55 // report the data as a metric
56 const gauge = meter.createObservableGauge("data.metric");
57 for (const d of processed) {
58 gauge.addCallback((m) => {
59 m.observe(d.attribute);
60 });
61 }
62
63 // emit a custom log
64 logger.emit({
65 severityNumber: SeverityNumber.INFO,
66 severityText: "INFO",
67 body: "returning data",
68 attributes: {processed},
69 });
70
71 return NextResponse.json(processed);
72}

In this full handler example, you can see how to emit a trace, log, and metric using the native OpenTelemetry constructs. It’s evident that the API is quite verbose and not simple to work with. For the LaunchDarkly platform, we’ve created a Node.js SDK that wraps OpenTelemetry to simplify the API streamline data reporting, with simple APIs. For example, here’s the same handler using our SDK:

1import { H } from '@highlight-run/node';
2
3// the Highlight SDK instrumentation can happen in each route
4// or globally for the whole application in your `instrumentation.ts` file
5H.init('YOUR_PROJECT_ID', {
6 // ... options to configure the SDK
7});
8
9// This is an example implementation of a route that fetches data from a Python service
10export async function GET() {
11 const {email, name} = req.query;
12
13 console.log("Fetching data...", {email});
14 const response = await fetch(
15 `https://api.sampleapis.com/coffee/hot`,
16 {
17 method: "POST",
18 headers: {"Content-Type": "application/json"},
19 body: JSON.stringify({
20 email,
21 }),
22 },
23 );
24 if (!response.ok) {
25 throw new Error("Failed to fetch data");
26 }
27 const data = await response.json();
28
29 // create a span for data processing that may be complex
30 const processed = await H.startActiveSpan(
31 "data.process",
32 async (span) => {
33 span.setAttributes({
34 "user.email": email || undefined,
35 "user.name": name || undefined,
36 });
37 // do something that may be slow
38 data.map((d) => ({
39 ...d,
40 calculated: d.value ?? 0 * 1.23
41 }))
42 });
43
44 // report the data as a metric
45 for (const d of data) {
46 H.recordMetric('data.metric', d.attribute);
47 }
48
49 // emit a custom log
50 H.log('returning data', {data});
51
52 return NextResponse.json(data);
53}

Conclusion

With the full suite of instrumentation configured, you’ll start to see valuable data in your LaunchDarkly dashboard. This data empowers you to enhance your troubleshooting workflows significantly.

By visualizing response times, error rates, and detailed error reports, you can quickly identify performance bottlenecks and areas for improvement. For instance, if you notice a spike in response times for a specific API endpoint, you can drill down into the traces to see what might be causing the delay.

Additionally, the error rate metrics allow you to monitor the health of your application in real-time. If an increase in errors is detected, you can leverage the detailed error reports to understand the context and root cause, enabling you to address issues proactively.

Overall, integrating OpenTelemetry with LaunchDarkly not only provides you with observability but also equips you with the insights needed to optimize your application and enhance user experience. Start leveraging this powerful combination today to take your monitoring and troubleshooting capabilities to the next level!
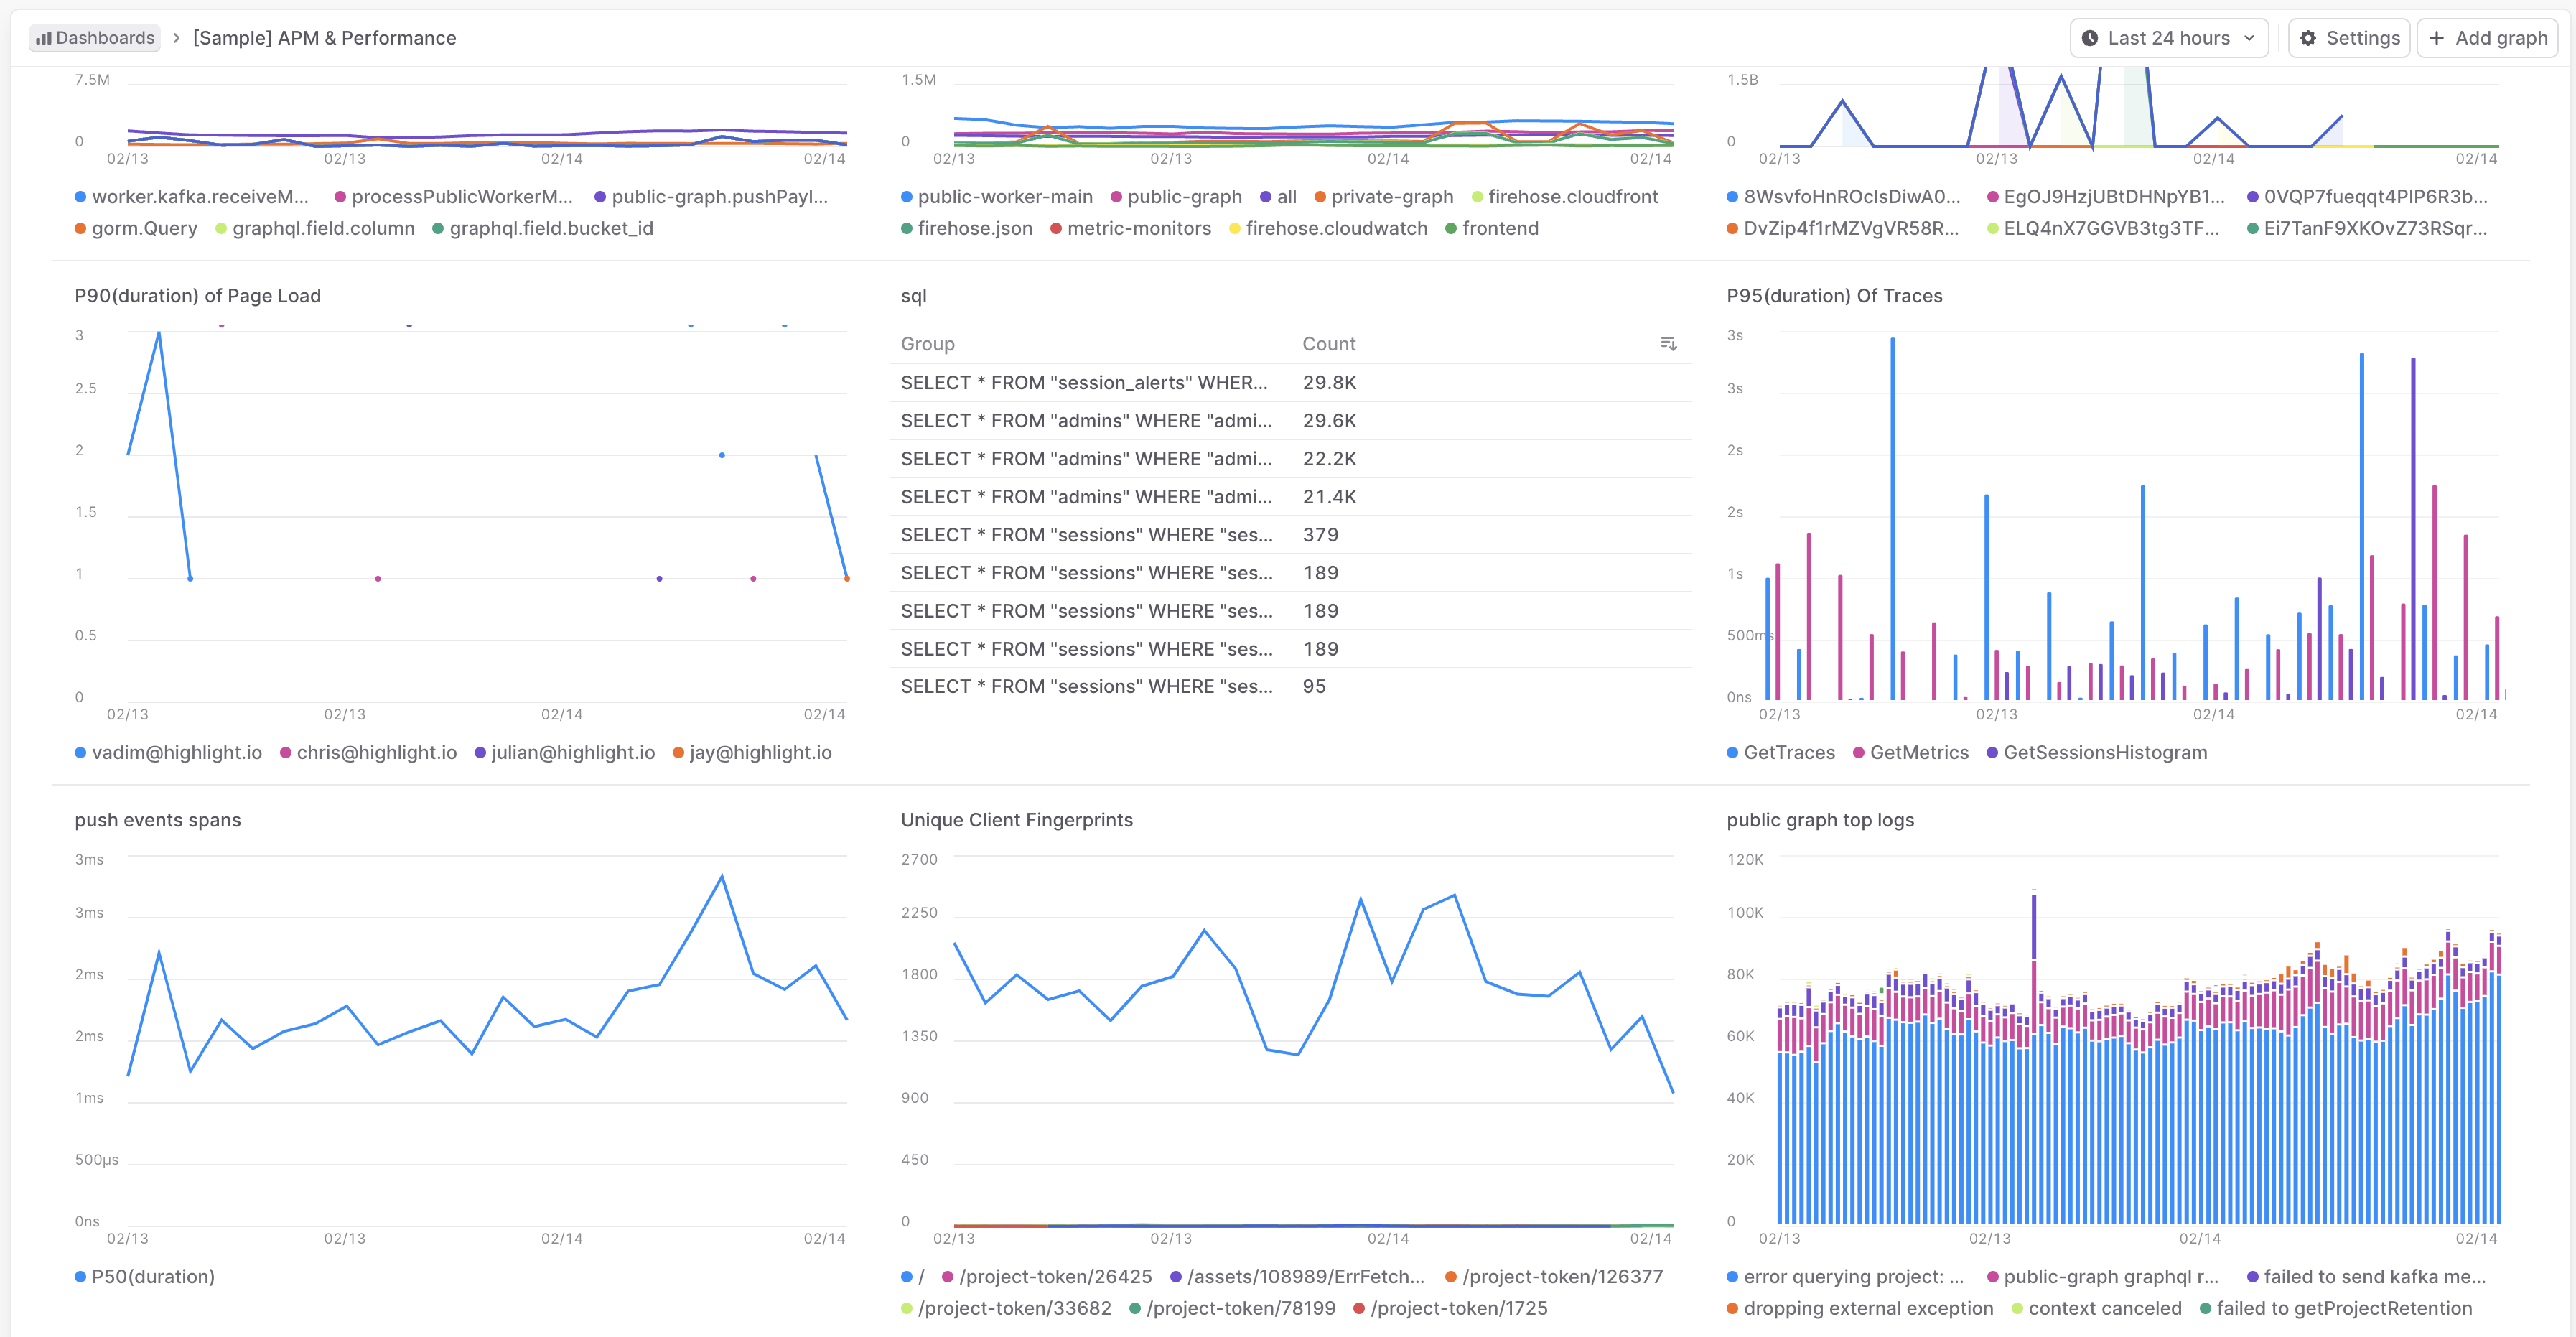
LaunchDarkly dashboard displaying traces, logs, and metrics from a Next.js application.

LaunchDarkly dashboard displaying traces, logs, and metrics from a Next.js application.

You can see the traces, logs, and metrics in the dashboard and use them to troubleshoot issues and optimize your application.