For AI agents: a documentation index is available at the root level at /llms.txt and /llms-full.txt. Append /llms.txt to any URL for a page-level index, or .md for the markdown version of any page.
Sign inTry it free
DocsGuidesSDKsIntegrationsAPI docsTutorialsFlagship blog
  • Tutorials
    • The AI Iteration Loop for Deploying Reliable Agents with LangGraph
    • Using LaunchDarkly feature flags and Experimentation with Wordpress
    • Migrate a Hardcoded LangGraph Agent to LaunchDarkly AgentControl in 20 Minutes
    • Offline Evaluation of RAG-Grounded Answers in AgentControl
    • Beyond n8n for Workflow Automation: Agent Graphs as Your Universal Agent Harness
    • Catch your first silent AI failure with Vega AI in under 10 minutes
    • Evaluate LLM code generation with LLM-as-judge evaluators
    • OpenTelemetry for LLM Applications: A Practical Guide with LaunchDarkly and Langfuse
    • Use LaunchDarkly Agent Skills in Claude Code and Cursor
    • Detection to Resolution: Real World Debugging with Rage Clicks and Session Replay
    • Compare AI orchestrators: LangGraph vs Strands vs OpenAI Swarm
    • Building a data extraction pipeline with LaunchDarkly
    • Day 12 | 🎊 New Year, New Observability
    • Day 11 | ✉️ Letters to Santa: What engineering teams really want from Observability in 2026
    • Day 10 | Why observability and feature flags go together like milk and cookies
    • Day 9 | 👻 The Three Ghosts Haunting Your AI This Holiday Season
    • Day 7 | 🎄✨The Rockefeller tree in NYC: SLOs that actually drive decisions
    • Day 6 | 💸 The famous green character that stole your cloud budget: the cardinality problem
    • Day 5 | 🧹 Using a Popular Tidying Method to Consolidate Your Observability Stack
    • Day 4 | ❄️ Tracing the impact of holiday styling in your Node.js app
    • Day 8 | 🎁 Observable Multi-Modal Agentic Systems
    • Day 3 | 🔔 Jingle All the Way to Zero-Config Observability
    • Day 2 | 🎅 He knows if you have been bad or good... But what if he gets it wrong?
    • Collecting user feedback in your app with feature flags
    • Day 1 | 🎄 Observability Under the Tree: What Changed in 2025
    • Build a User Frustration Detection & Response System
    • When to Add Online Evals to Your AgentControl
    • Detecting User Frustration: Understanding Rage Clicks and Session Replay
    • AgentControl config CI/CD Pipeline: Automated Quality Gates and Safe Deployment
    • A Deeper Look at LaunchDarkly Architecture: More than Feature Flags
    • Add Observability to Your React Native App in 5 minutes
    • Smart AI Agent Targeting with MCP Tools
    • Build a LangGraph Multi-Agent System in 20 Minutes with LaunchDarkly AgentControl
    • Snowflake Cortex Completion API + LaunchDarkly SDK Integration
    • Using AgentControl to review database changes
    • How to implement WebSockets and kill switches in a Python application
    • 4 hacks to turbocharge your Cursor productivity
    • Create a feature flag in your IDE in 5 minutes with LaunchDarkly's MCP server
    • Observability for Your Go ORM: OpenTelemetry Integration with GORM
    • The complete guide to OpenTelemetry in Next.js
    • How to instrument your React Native app with OpenTelemetry
    • The complete guide to OpenTelemetry in Python
    • Monitoring Browser Applications with OpenTelemetry
    • How to Use OpenTelemetry to Monitor Next.js Applications
    • What is OpenTelemetry and Why Should I Care?
    • Distributed Tracing in Next.js Apps
    • Tracing Distributed Systems in Next.js
    • Real-time Monitoring in Django: Essential Tools and Techniques
    • DeepSeek vs Qwen: local model showdown featuring LaunchDarkly AgentControl
    • Application Tracing in .NET for Performance Monitoring
    • The Ultimate Guide to Ruby Logging: Best Libraries and Practices
    • Using Materialized Views in ClickHouse (vs. Postgres)
    • Filtering and Sampling LaunchDarkly Ingest
    • How to Set Up Your Production AWS MSK Kafka Cluster
    • Publishing an NPM Package with Private pnpm Monorepo Dependencies
    • How To Use The Chrome Inspector & Debugger
    • 3 Levels of Data Validation in a Full Stack Application With React
    • The power of the monorepo: Keep your fullstack app in sync!
    • Compression: The simple, powerful upgrade for your web stack
    • Video tutorials
Sign inTry it free
LogoLogo
On this page
  • Setup Networking
  • Private Access
  • Public Access
  • Network
  • Security
  • Setting up ACLs
  • Size your Cluster
  • Serverless vs. Provisioned Cluster Type
  • Creating a Topic
  • Configure Monitoring Tools
Tutorials

How to Set Up Your Production AWS MSK Kafka Cluster

Was this page helpful?
Previous

Publishing an NPM Package with Private pnpm Monorepo Dependencies

Next
Built with

Published February 15, 2023

portrait of Vadim Korolik.

by Vadim Korolik

Looking to set up your own Kafka cluster? AWS MSK is a great choice for a managed Kafka solution, but setting it up correctly can be tricky. We’ll go step-by-step through what you need to do.

Setup Networking

Depending on how you will be connecting to the cluster, you’ll need to configure the networking settings accordingly. If you are only connecting to Kafka from inside your private VPC, then private networking is typically sufficient. On the other hand, if you’re planning to connect to the cluster from the internet (ie. if you were using the Kafka cluster as a development instance from your local machine), you’ll need to set up public access. You will also need public access if you plan to monitor your cluster from a tool hosted on the internet, like with provectuslabs.

Private Access

Setting up a private AWS MSK cluster is the default. Visit your region of the AWS MSK UI, click Create Cluster and then select Custom Create. The default settings will prefer a serverless cluster, but you may want to switch to a provisioned one. Configure your instance size per our sizing guide below. When you visit the networking page, you’ll need to choose or create a private VPC and set the subnets. If you chose to deploy the cluster in 2 availability zones on the first page, then you’ll only need 2 subnets. The number of availability zones your cluster is deployed to will dictate the minimum size of the cluster but also its reliability. If you intend to have a production workload, use a 3-AZ configuration.

Public Access

After picking your public VPC and public subnets, you’ll see a note about Public Access being off. Public Access can only be turned on after the configuration of the cluster, but it requires some things to be configured a certain way during this initial setup. The AWS docs describe the requirements here. Pay attention to the original setup flow as these settings cannot be changed after cluster creation. In short, they are:

Network

  • The VPC and all Subnets must be public.

Security

  • Unauthenticated access must be turned off, and at least one secured access method must be on of SASL/IAM, SASL/SCRAM, or mTLS. You’ll likely want to use SASL/SCRAM. You’ll need to create a username an password, enroll them in AWS Secrets Manager, and configure Kafka to use that.
  • Encryption within the cluster must be turned on.
  • Plaintext traffic between brokers and clients must be off
  • Setup ACLs with configuration property allow.everyone.if.no.acl.found to false. This is done via the Cluster Configuration. You can create the cluster with the default configuration and edit it later to add this setting.

For SASL/SCRAM authentication, you’ll set the user/password after the cluster is created. For encryption, you’ll want to use your own key created in AWS KMS.
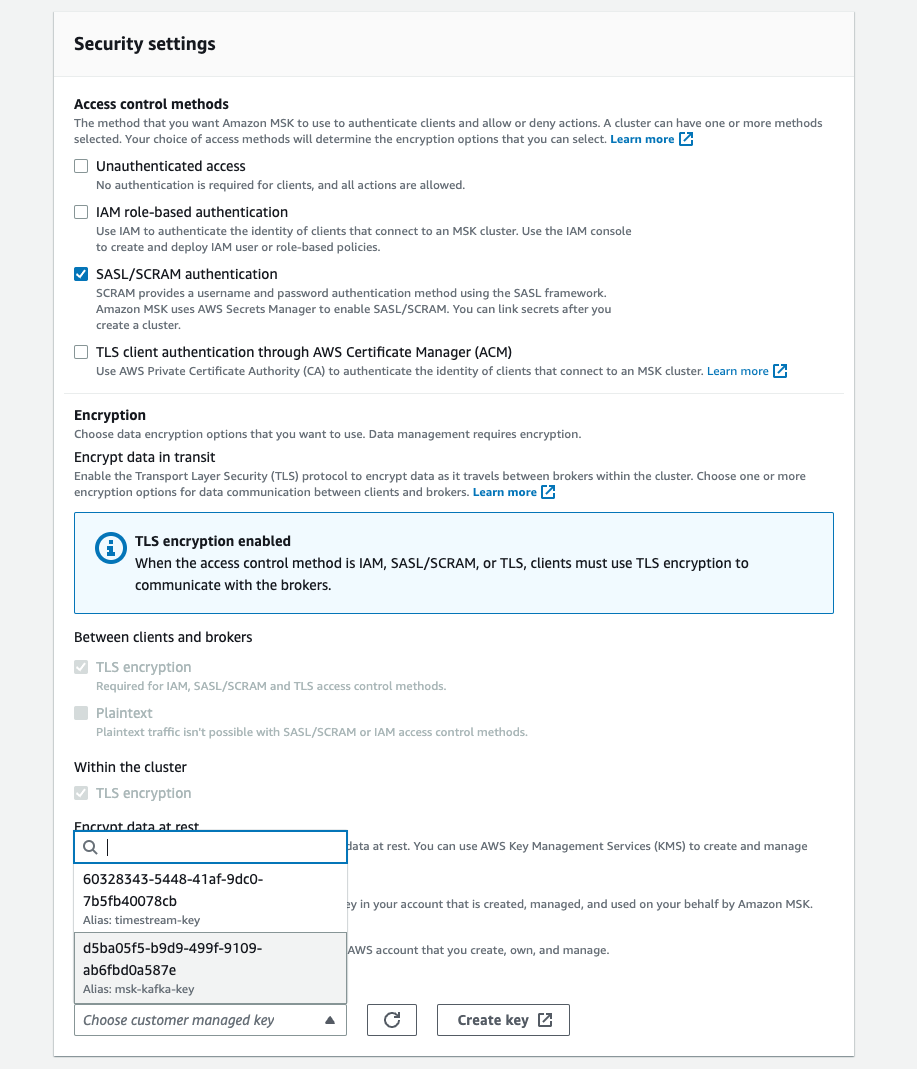
AWS MSK cluster security settings showing SASL/SCRAM authentication and encryption configuration options.

AWS MSK cluster security settings showing SASL/SCRAM authentication and encryption configuration options.

Once a cluster is created with these settings, you’ll find that the cluster properties allow you to Edit Public Access.

AWS MSK cluster properties page showing the Edit Public Access option.

AWS MSK cluster properties page showing the Edit Public Access option.

Setting up ACLs

Once you’ve set up public access, accessing the cluster remotely will give you a Not Authorized error to consumers and producers. You may see a message like Not Authorized to access group or Topic Authorization Failed. Even though you’ve enabled public access, setting up ACLs requires private access to the zookeeper nodes this one time to be able to perform this configuration. What you’ll need to do is set up an EC2 instance inside your MSK VPC but on a private subnet and then access the MSK cluster using the private zookeeper string.

Per the AWS docs:

  • Create an EC2 instance using the Amazon Linux 2 AMI
  • SSH as ec2-user
  • Run the following, replacing $ZK_CONN with the Plaintext Apache ZooKeeper connection string from your AWS MSK Client Information button.

AWS MSK Client Information panel showing the plaintext Apache ZooKeeper connection string.

AWS MSK Client Information panel showing the plaintext Apache ZooKeeper connection string.
sudo yum -y install java-11
wget https://archive.apache.org/dist/kafka/2.8.1/kafka_2.12-2.8.1.tgz
tar -xzf kafka_2.12-2.8.1.tgz
cd kafka_2.12-2.8.1/bin
export ZK_CONN="YOUR ZOOKEEPER PLAINTEXT CONNECTION STRING"
export USER="YOUR SASL SCRAM USERNAME CHOSEN DURING SECURITY SETUP"
export TOPIC="YOUR TOPIC NAME"
./kafka-acls.sh --authorizer-properties zookeeper.connect=$ZK_CONN --add --allow-principal "User:$USER" --operation Read --group="*" --topic $TOPIC
./kafka-acls.sh --authorizer-properties zookeeper.connect=$ZK_CONN --add --allow-principal "User:$USER" --operation Write --topic $TOPIC
./kafka-acls.sh --authorizer-properties zookeeper.connect=$ZK_CONN --add --allow-principal "User:$USER" --operation Describe --group="*" --topic $TOPIC

See the AWS docs for more details about the specific ACLs that you need to setup. We also often reference the Confluent Kafka ACL docs for knowing what the different permissions are.

Size your Cluster

Serverless vs. Provisioned Cluster Type

A serverless cluster automatically scales based on read/write throughput, while a provisioned cluster has a consistent number of brokers of a particular size. A serverless cluster makes sense for lower throughputs as there is a maximum of 200 MiB/second writes and 400 MiB/second reads, but the cluster will adjust to only charge for the throughput you use. You’ll pay per partition-hours as well, so a large number of partitions may be expensive.

A provisioned cluster will perform consistently depending on the instance type and number of brokers and would be recommended for larger production environments. For context, we currently send about 5k messages / second at a 1 MB average size at about 300 MB/second of throughput.

To find an optimal broker size, we reduced our instance types until our broker CPU usage was near 50% at the peak. We’ve found that an increase in partitions will linearly increase CPU usage and will substantially increase memory pressures on the cluster. For our workload at nearly 3000 partitions, a 3-broker cluster of kafka.m5.2xlarge nodes has worked reliably.

Creating a Topic

Using the configured instance, create a topic by using the kafka-topics.sh helper. Following the AWS MSK documentation, run the following commands:

# put the value from your AWS MSK private authenticated endpoint, since the EC2 instance is in the same VPC as the cluster.
# if you are using SASL/SCRAM, this should be your private endpoint for SASL/SCRAM.
# it should be something like XXX:9096,YYY:9096,ZZZ:9096
export BOOTSTRAP_SERVER_STRING="YOUR BOOTSTRAP SERVER STRING"
# the number of partitions dictates the number of concurrent consumers in your topic.
# you can always increase this number in the future, but you won't be able to decrease it
export PARTITIONS=1
# the number of brokers that store a partition.
# ex. for a value of 3, 2 brokers can be offline and 1 will still be able to serve all partitions.
export REPLICATION_FACTOR=3
echo 'security.protocol=SASL_SSL\
sasl.mechanism=AWS_MSK_IAM\
sasl.jaas.config=software.amazon.msk.auth.iam.IAMLoginModule required;\
sasl.client.callback.handler.class=software.amazon.msk.auth.iam.IAMClientCallbackHandler\
' > client.properties
./kafka-topics.sh --create --bootstrap-server $BOOTSTRAP_SERVER_STRING --command-config client.properties --replication-factor $REPLICATION_FACTOR --partitions $PARTITIONS --topic $TOPIC

Configure Monitoring Tools

For monitoring your cluster, we use the provectuslabs/kafka-ui docker image. If running a private kafka cluster, you’ll want it deployed in the same VPC as your cluster.
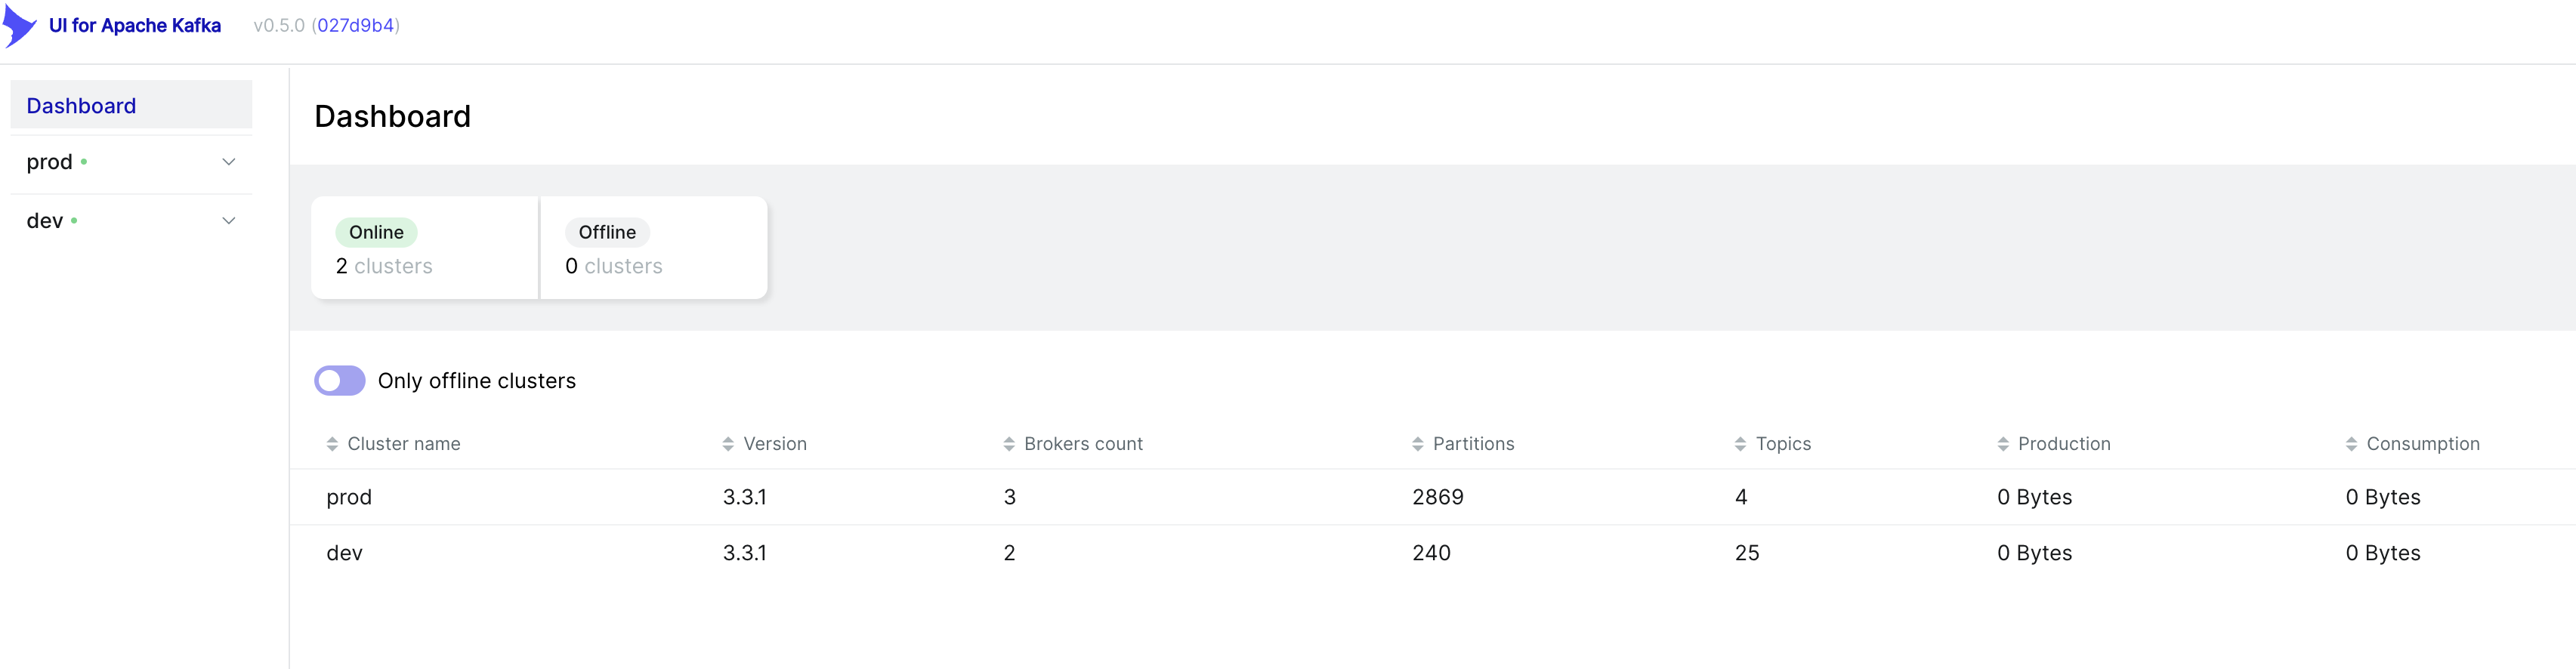
Kafka UI dashboard from provectuslabs showing cluster brokers, topics, and consumer group monitoring.

Kafka UI dashboard from provectuslabs showing cluster brokers, topics, and consumer group monitoring.

The tool gives you a few neat features:

  • View the state of brokers in your cluster
  • Monitor partitions in your topic, including their replication state.
  • View messages in a particular topic, either live or scanning the newest ones in a partition.
  • Monitor a consumer group to know how far behind it is, and how many members it has.

We’ve found it particularly useful for troubleshooting production issues with our clusters, such as identifying that a broker is down and causing write errors. In development, the tool was very useful to view the messages as raw strings, allowing troubleshooting other parts of our data processing pipeline.

Since we serialize our messages in kafka as JSON, they are easy to read and understand. Here’s an example of our message format, decompressed and formatted:
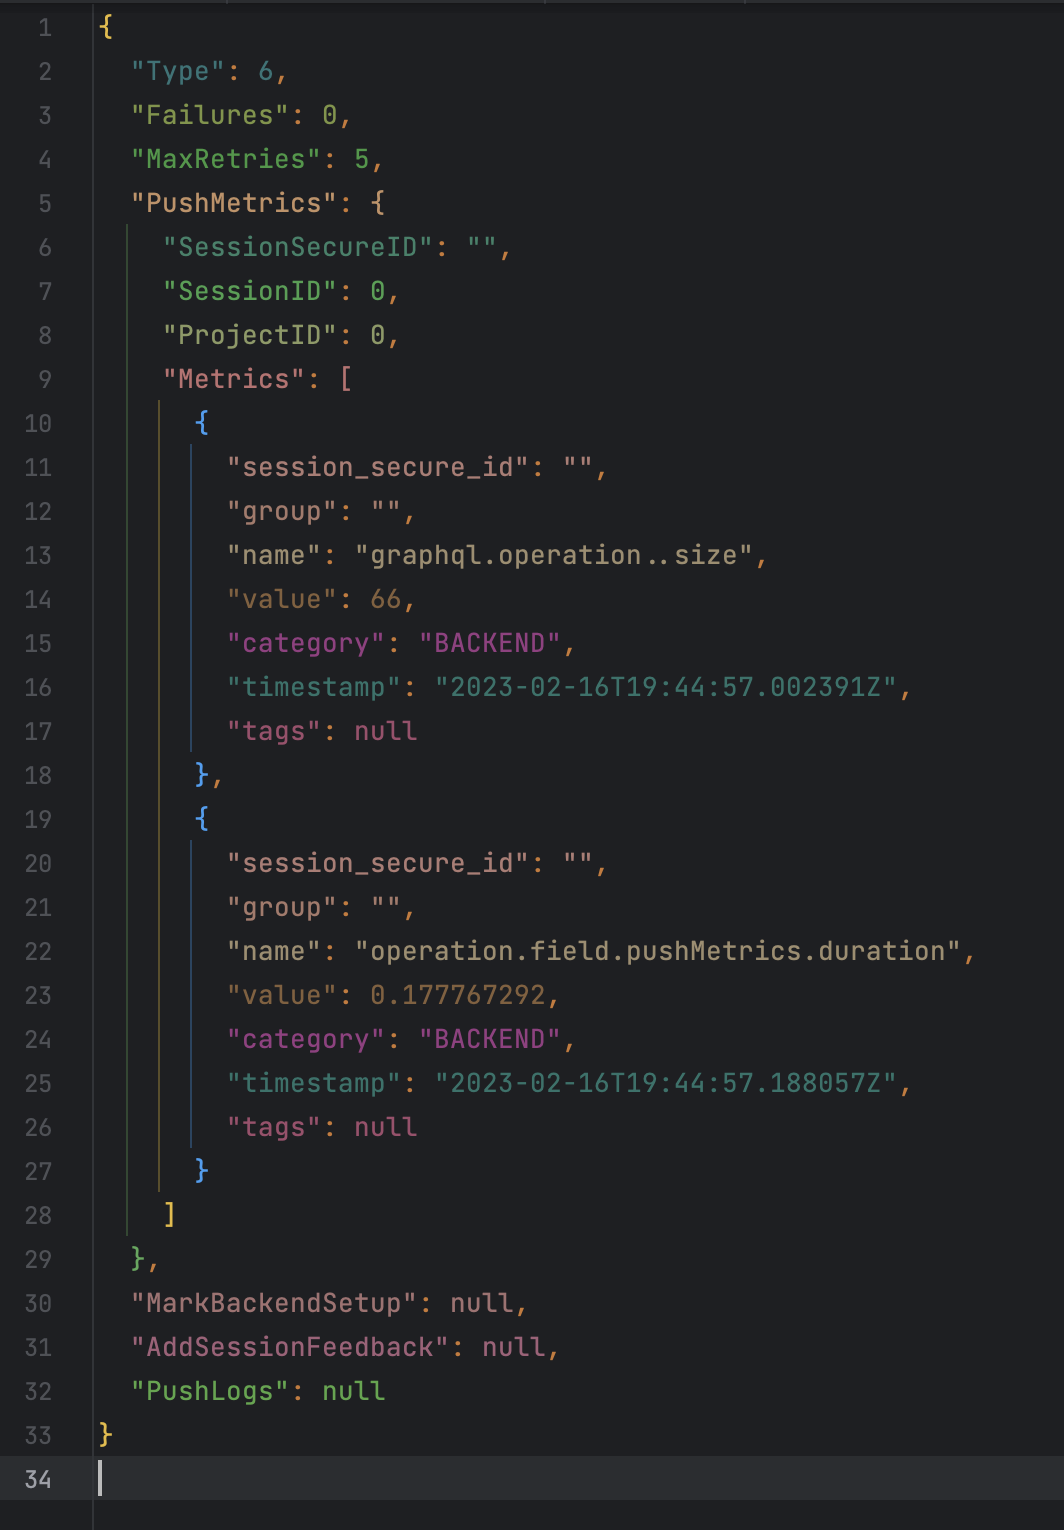
Example of a decompressed and formatted JSON Kafka message showing the message structure used by LaunchDarkly.

Example of a decompressed and formatted JSON Kafka message showing the message structure used by LaunchDarkly.

For more info about how we structure our data and configured our cluster, see our other blog. We have a lot of learnings there about how we defined our message model, configured log retention, and fixed a critical data loss issue caused by enabling log compaction.