For AI agents: a documentation index is available at the root level at /llms.txt and /llms-full.txt. Append /llms.txt to any URL for a page-level index, or .md for the markdown version of any page.
Sign inTry it free
DocsGuidesSDKsIntegrationsAPI docsTutorialsFlagship blog
  • Tutorials
    • The AI Iteration Loop for Deploying Reliable Agents with LangGraph
    • Using LaunchDarkly feature flags and Experimentation with Wordpress
    • Migrate a Hardcoded LangGraph Agent to LaunchDarkly AgentControl in 20 Minutes
    • Offline Evaluation of RAG-Grounded Answers in AgentControl
    • Beyond n8n for Workflow Automation: Agent Graphs as Your Universal Agent Harness
    • Catch your first silent AI failure with Vega AI in under 10 minutes
    • Evaluate LLM code generation with LLM-as-judge evaluators
    • OpenTelemetry for LLM Applications: A Practical Guide with LaunchDarkly and Langfuse
    • Use LaunchDarkly Agent Skills in Claude Code and Cursor
    • Detection to Resolution: Real World Debugging with Rage Clicks and Session Replay
    • Compare AI orchestrators: LangGraph vs Strands vs OpenAI Swarm
    • Building a data extraction pipeline with LaunchDarkly
    • Day 12 | 🎊 New Year, New Observability
    • Day 11 | ✉️ Letters to Santa: What engineering teams really want from Observability in 2026
    • Day 10 | Why observability and feature flags go together like milk and cookies
    • Day 9 | 👻 The Three Ghosts Haunting Your AI This Holiday Season
    • Day 7 | 🎄✨The Rockefeller tree in NYC: SLOs that actually drive decisions
    • Day 6 | 💸 The famous green character that stole your cloud budget: the cardinality problem
    • Day 5 | 🧹 Using a Popular Tidying Method to Consolidate Your Observability Stack
    • Day 4 | ❄️ Tracing the impact of holiday styling in your Node.js app
    • Day 8 | 🎁 Observable Multi-Modal Agentic Systems
    • Day 3 | 🔔 Jingle All the Way to Zero-Config Observability
    • Day 2 | 🎅 He knows if you have been bad or good... But what if he gets it wrong?
    • Collecting user feedback in your app with feature flags
    • Day 1 | 🎄 Observability Under the Tree: What Changed in 2025
    • Build a User Frustration Detection & Response System
    • When to Add Online Evals to Your AgentControl
    • Detecting User Frustration: Understanding Rage Clicks and Session Replay
    • AgentControl config CI/CD Pipeline: Automated Quality Gates and Safe Deployment
    • A Deeper Look at LaunchDarkly Architecture: More than Feature Flags
    • Add Observability to Your React Native App in 5 minutes
    • Smart AI Agent Targeting with MCP Tools
    • Build a LangGraph Multi-Agent System in 20 Minutes with LaunchDarkly AgentControl
    • Snowflake Cortex Completion API + LaunchDarkly SDK Integration
    • Using AgentControl to review database changes
    • How to implement WebSockets and kill switches in a Python application
    • 4 hacks to turbocharge your Cursor productivity
    • Create a feature flag in your IDE in 5 minutes with LaunchDarkly's MCP server
    • Observability for Your Go ORM: OpenTelemetry Integration with GORM
    • The complete guide to OpenTelemetry in Next.js
    • How to instrument your React Native app with OpenTelemetry
    • The complete guide to OpenTelemetry in Python
    • Monitoring Browser Applications with OpenTelemetry
    • How to Use OpenTelemetry to Monitor Next.js Applications
    • What is OpenTelemetry and Why Should I Care?
    • Distributed Tracing in Next.js Apps
    • Tracing Distributed Systems in Next.js
    • Real-time Monitoring in Django: Essential Tools and Techniques
    • DeepSeek vs Qwen: local model showdown featuring LaunchDarkly AgentControl
    • Application Tracing in .NET for Performance Monitoring
    • The Ultimate Guide to Ruby Logging: Best Libraries and Practices
    • Using Materialized Views in ClickHouse (vs. Postgres)
    • Filtering and Sampling LaunchDarkly Ingest
    • How to Set Up Your Production AWS MSK Kafka Cluster
    • Publishing an NPM Package with Private pnpm Monorepo Dependencies
    • How To Use The Chrome Inspector & Debugger
    • 3 Levels of Data Validation in a Full Stack Application With React
    • The power of the monorepo: Keep your fullstack app in sync!
    • Compression: The simple, powerful upgrade for your web stack
    • Video tutorials
Sign inTry it free
LogoLogo
On this page
  • Why Observability Matters for Databases
  • How to Integrate OpenTelemetry with GORM
  • How to Use Traces and Metrics to Diagnose and Optimize
  • Working with Traces
  • Aggregated Traces
  • Working with Metrics
  • Conclusion
Tutorials

Observability for Your Go ORM: OpenTelemetry Integration with GORM

Was this page helpful?
Previous

The complete guide to OpenTelemetry in Next.js

Next
Built with

Published February 20, 2025

portrait of Chris Schmitz.

by Chris Schmitz

GORM is a popular ORM for Go that allows you to interact with databases using Go structs. It’s a great way to improve the ergonomics of interacting with your database, but it does come with some tradeoffs.

When you use an ORM, you are abstracting away the details of the actual queries. This can make it difficult to diagnose issues and optimize for performance.

Using OpenTelemetry, we can collect observability data about how our database is performing and help identify and fix issues quickly.

In this blog post, we’ll walk through how to integrate OpenTelemetry with GORM to provide traces and metrics for your database.

Why Observability Matters for Databases

It may not be obvious why observability matters for databases, so let’s quickly cover the benefits. We can collect a few types of data about our database:

  • Infrastructure metrics (e.g. CPU, memory, disk, etc.)
  • Query performance (latency, errors, etc.)
  • Resource utilization (connections, threads, etc.)

With these metrics, we can diagnose and optimize for issues like:

  • Slow queries
  • High error rates
  • Connection pool bottlenecks
  • Resource contention

The GORM OpenTelemetry plugin streamlines the process of collecting this data.

How to Integrate OpenTelemetry with GORM

The GORM OpenTelemetry plugin is a great way to integrate OpenTelemetry with GORM. It’s easy to install and use, and it provides a lot of useful data about your database.

First, install the plugin:

$go get gorm.io/plugin/opentelemetry/tracing

Then, initialize your database and enable the instrumentation:

1import (
2 "gorm.io/gorm"
3 "gorm.io/driver/postgres"
4 "gorm.io/plugin/opentelemetry/tracing"
5)
6
7// Initialize your database
8db, err := gorm.Open(postgres.Open("your-dsn-here"), &gorm.Config{})
9if err != nil {
10 log.Fatal(err)
11}
12
13// Enables the OpenTelemetry instrumentation
14db.Use(tracing.NewPlugin())

Assuming you already have OpenTelemetry configured, you’ll see traces and metrics exported for your database interactions. If you don’t have OpenTelemetry configured in your app, consider using the LaunchDarkly Go SDK to set this up quickly.

How to Use Traces and Metrics to Diagnose and Optimize

Now that we have traces and metrics, how do we use them to diagnose and optimize our database? For our use case, we’ll use LaunchDarkly to visualize and work with the data.

Working with Traces

The GORM plugin will emit spans for each database interaction. If the query is part of an existing trace, the span will be connected to that trace. Here is an example of a web request that triggered a database query:
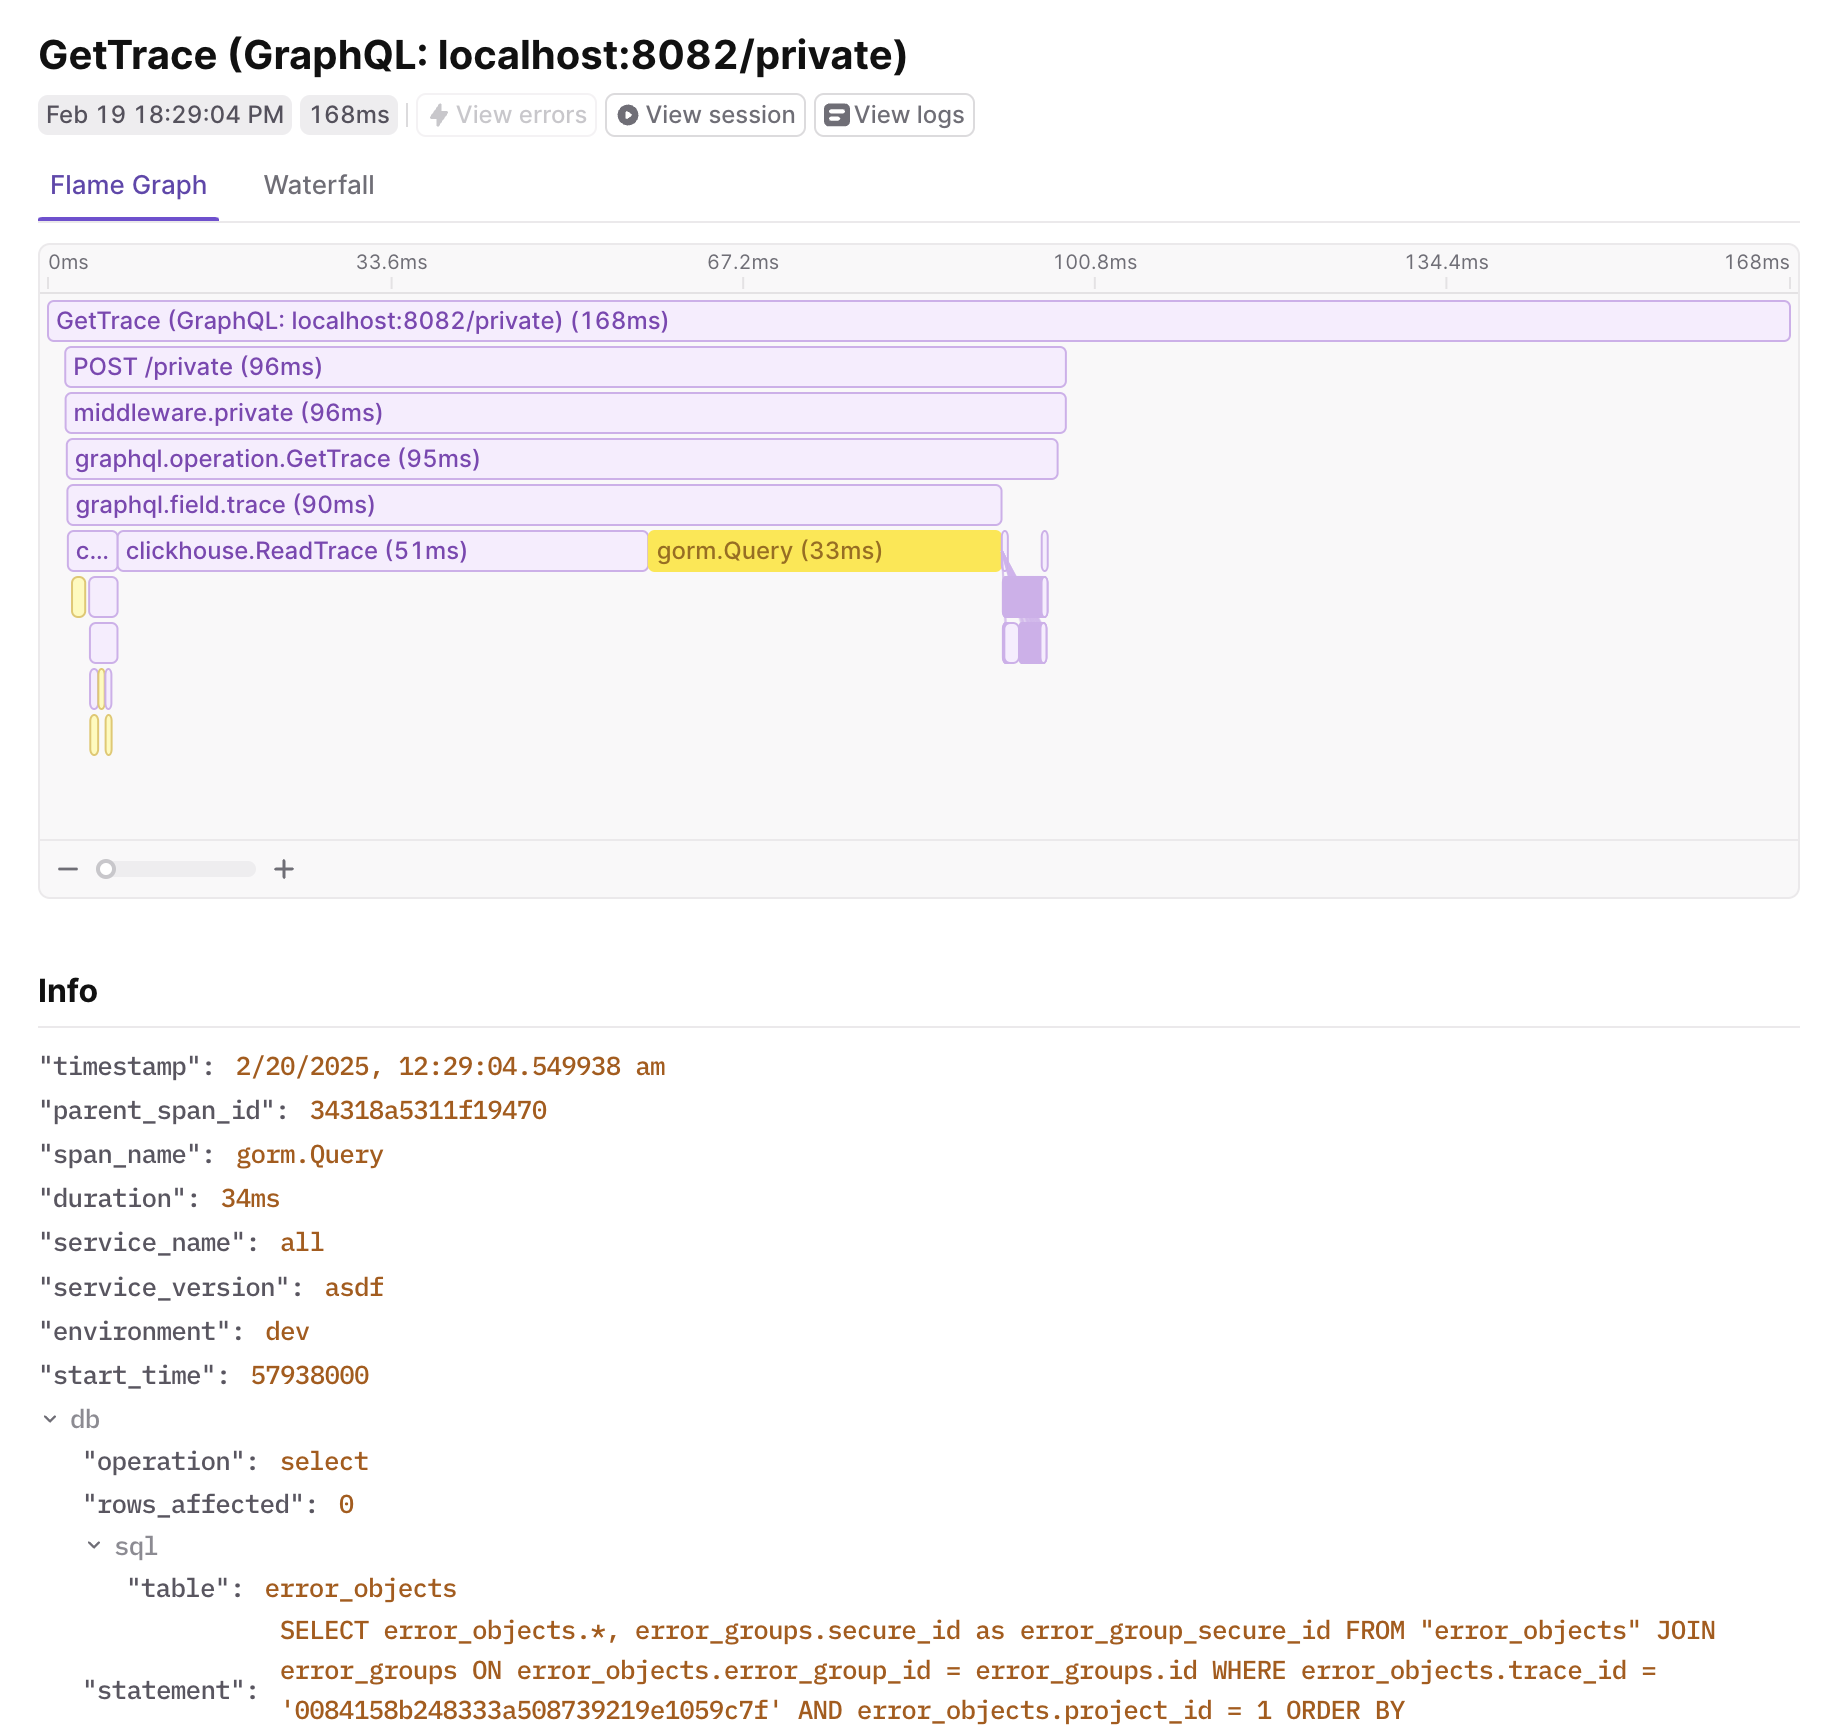
A trace span in LaunchDarkly showing a GORM database query with attributes like duration, SQL statement, and table name.

A trace span in LaunchDarkly showing a GORM database query with attributes like duration, SQL statement, and table name.

Note the attributes added to the span under the db key. We get information about the query that can be used to help understand and optimize it. We even get the SQL statement to so we have the exact query to run in a debugging session.

Aggregated Traces

Viewing an individual trace is helpful, but it’s often useful to see aggregate data for database interactions. Since we have attributes like duration, db.sql.table, and db.operation, we can use these to group and aggregate data.

A LaunchDarkly dashboard displaying aggregated GORM metrics including query counts, duration, and details of individual slow queries.

A LaunchDarkly dashboard displaying aggregated GORM metrics including query counts, duration, and details of individual slow queries.

Here you can see how dashboards are being used to monitor query counts, duration, and details of individual slow queries.

Working with Metrics

The OpenTelemetry GORM plugin will also emit metrics for the database. It currently only reports metrics around connections, which can be helpful for diagnosing issues with your connection pool health and capacity.

Note that the plugin does not have access to infrastructure metrics like CPU, memory, etc., which are also important for monitoring the health of your database. Many cloud providers can export these metrics for you. See Metrics in AWS as an example of how to get these metrics for AWS.

Conclusion

The GORM OpenTelemetry plugin is an easy way to start collecting observability data for your database. It will give you a lot of useful data for finding issues and optimizing your database.

If you’re interested in trying it out, check out the GORM OpenTelemetry plugin documentation for more information, or consider using the LaunchDarkly Go SDK to get started quickly.