
Beyond n8n for workflow automation: agent graphs as your universal agent harness
Beyond n8n for workflow automation: agent graphs as your universal agent harness
Published March 20, 2026

Hardcoded multi-agent orchestration is brittle: topology lives in framework-specific code, changes require redeploys, and bottlenecks are hard to see. Agent graphs externalize that topology into LaunchDarkly, while your application continues to own execution.
In this tutorial, you’ll build a small multi-agent workflow, traverse it with the SDK, monitor per-node latency on the graph itself, and update a slow node’s model without changing application code.
- Node = AgentControl config (model, instructions, tools)
- Edge = handoff metadata (routing contract you define)
- Graph = topology (which nodes connect)
- Your app = execution + interpretation
LaunchDarkly provides graph structure, config, and observability. Your application owns execution semantics: you write the code that interprets edges and runs agents.
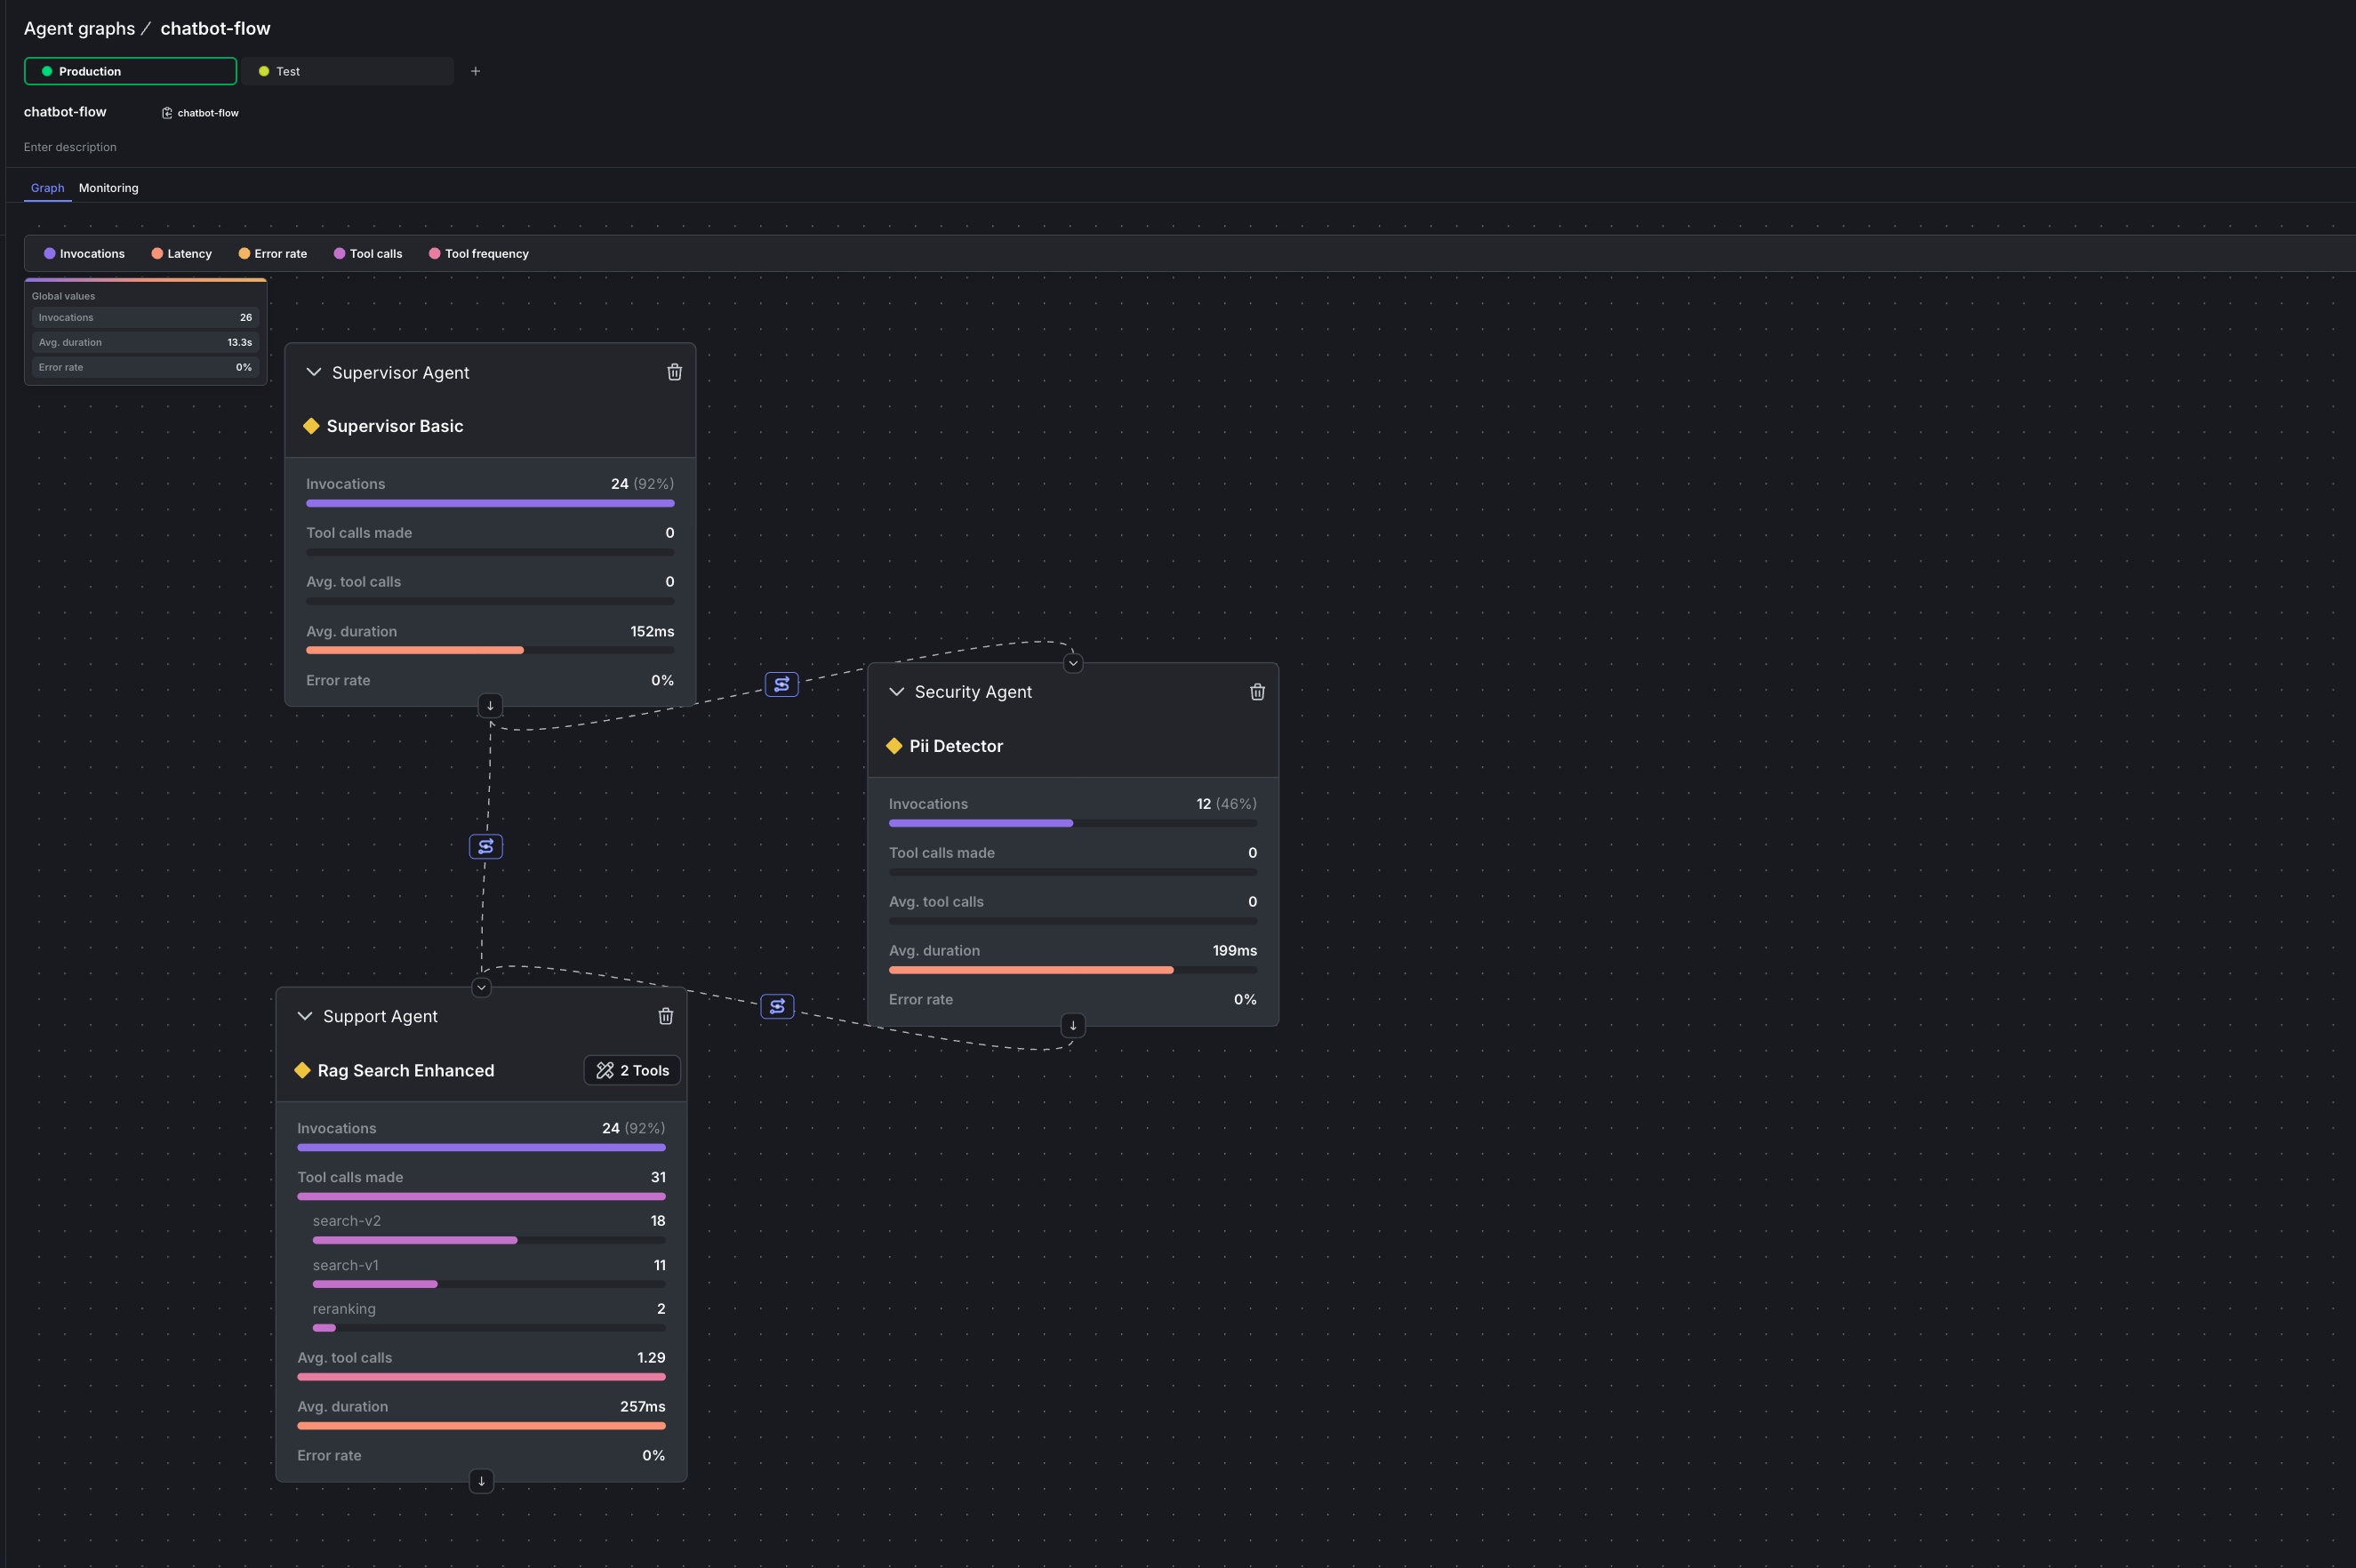
What you’ll build
In this tutorial, you’ll add agent graphs to an existing multi-agent workflow:
- Build a graph visually in the LaunchDarkly UI
- Connect it to your code with a few lines of SDK integration
- Run your agents and watch the graph in action
- Monitor performance with per-node latency and invocation tracking
- Fix a slow agent by swapping models in the LaunchDarkly UI
By the end, you’ll have a multi-agent system where topology metadata changes happen in the UI, picked up by your traversal code on the next request.
Prerequisites
- LaunchDarkly account with AgentControl access (sign up here)
- Python 3.9+
- An existing agent workflow (or use our sample repo)
The problem with hardcoded orchestration
Every multi-agent framework handles orchestration differently:
The topology is scattered across code. Agent graphs make it visible: you view the entire workflow in one place, edit connections in the UI, and traverse it with graph-aware SDK methods.
Why externalizing topology helps
If you’ve built multi-agent systems with LangGraph, OpenAI Swarm, or Strands, you’ve run into the same limitations:
- Config duplication: Agent definitions scattered across framework-specific formats
- Silent failures: An agent times out and you don’t know until users complain
- No topology visibility: The workflow exists only in code
- Custom observability: Getting consistent per-agent metrics means reconciling different trace formats and data schemas across frameworks
For a detailed comparison of LangGraph, OpenAI Swarm, and Strands, read Compare AI orchestrators. Agent graphs work with multiple agent frameworks.
Agent graphs solve these by giving you a visual graph builder where you:
- View your entire workflow at a glance, not buried in code
- Monitor per-node metrics overlaid directly on the graph (latency, invocations, tool calls)
- Add or remove agents without changing traversal logic, provided your runtime supports the node’s tools and output contract
- Inspect routing logic on edges, with handoff data visible in the UI
- Use graph-aware SDK methods like
is_terminal(),get_edges(), androot()instead of manual tracking
Step 1: Create a project and configs
Agent graphs live in a LaunchDarkly project alongside your configs. Create a dedicated project for this tutorial, then seed it with an AgentControl config for each agent. The bootstrap script below handles config setup. If you already have a project, skip to Step 2.
Ask your coding assistant to create the project with the LaunchDarkly MCP server (or the projects agent skill), or create one manually under Account settings > Projects. Then copy its SDK key and project key into your .env.
Use the AgentControl quickstart or run the bootstrap script in our sample repo to seed your project with the three configs:
The bootstrap script creates the configs in the project you set in LD_PROJECT_KEY.
For this tutorial, we’ll use three configs:
- supervisor-agent: Orchestrates the workflow and routes queries based on PII pre-screening
- security-agent: Detects and redacts personally identifiable information (PII)
- support-agent: Answers questions using dynamically loaded tools (search, RAG)
Step 2: Build the graph in the UI
This is where agent graphs diverge from code-based orchestration. Instead of writing add_edge() calls, you’ll view your topology and modify it visually.
Open the LaunchDarkly UI and navigate to AI > Agent graphs.
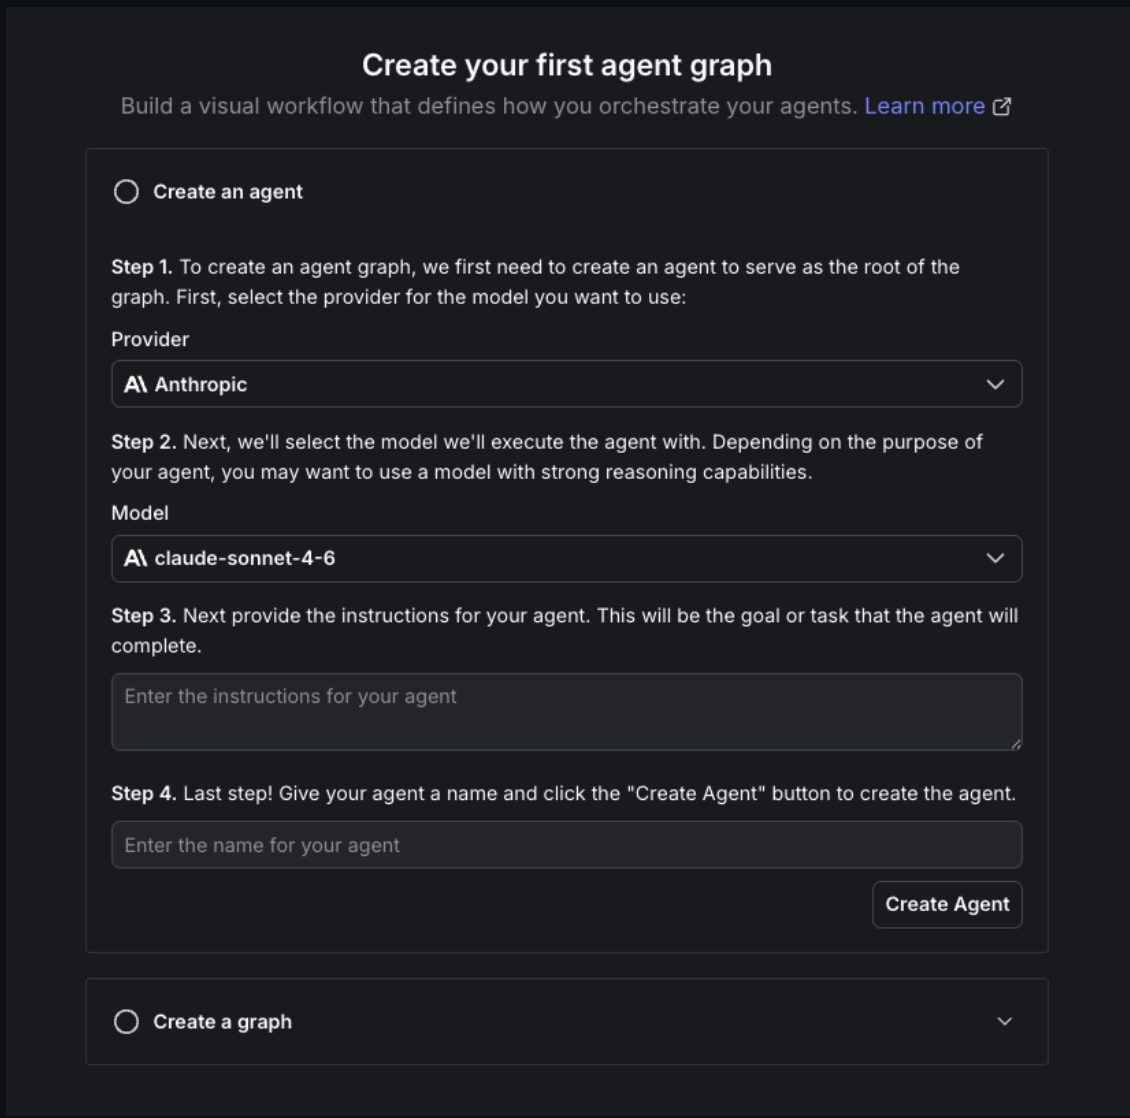
- The first-time setup wizard appears. Since you already created configs in Step 1, expand Create a graph at the bottom.
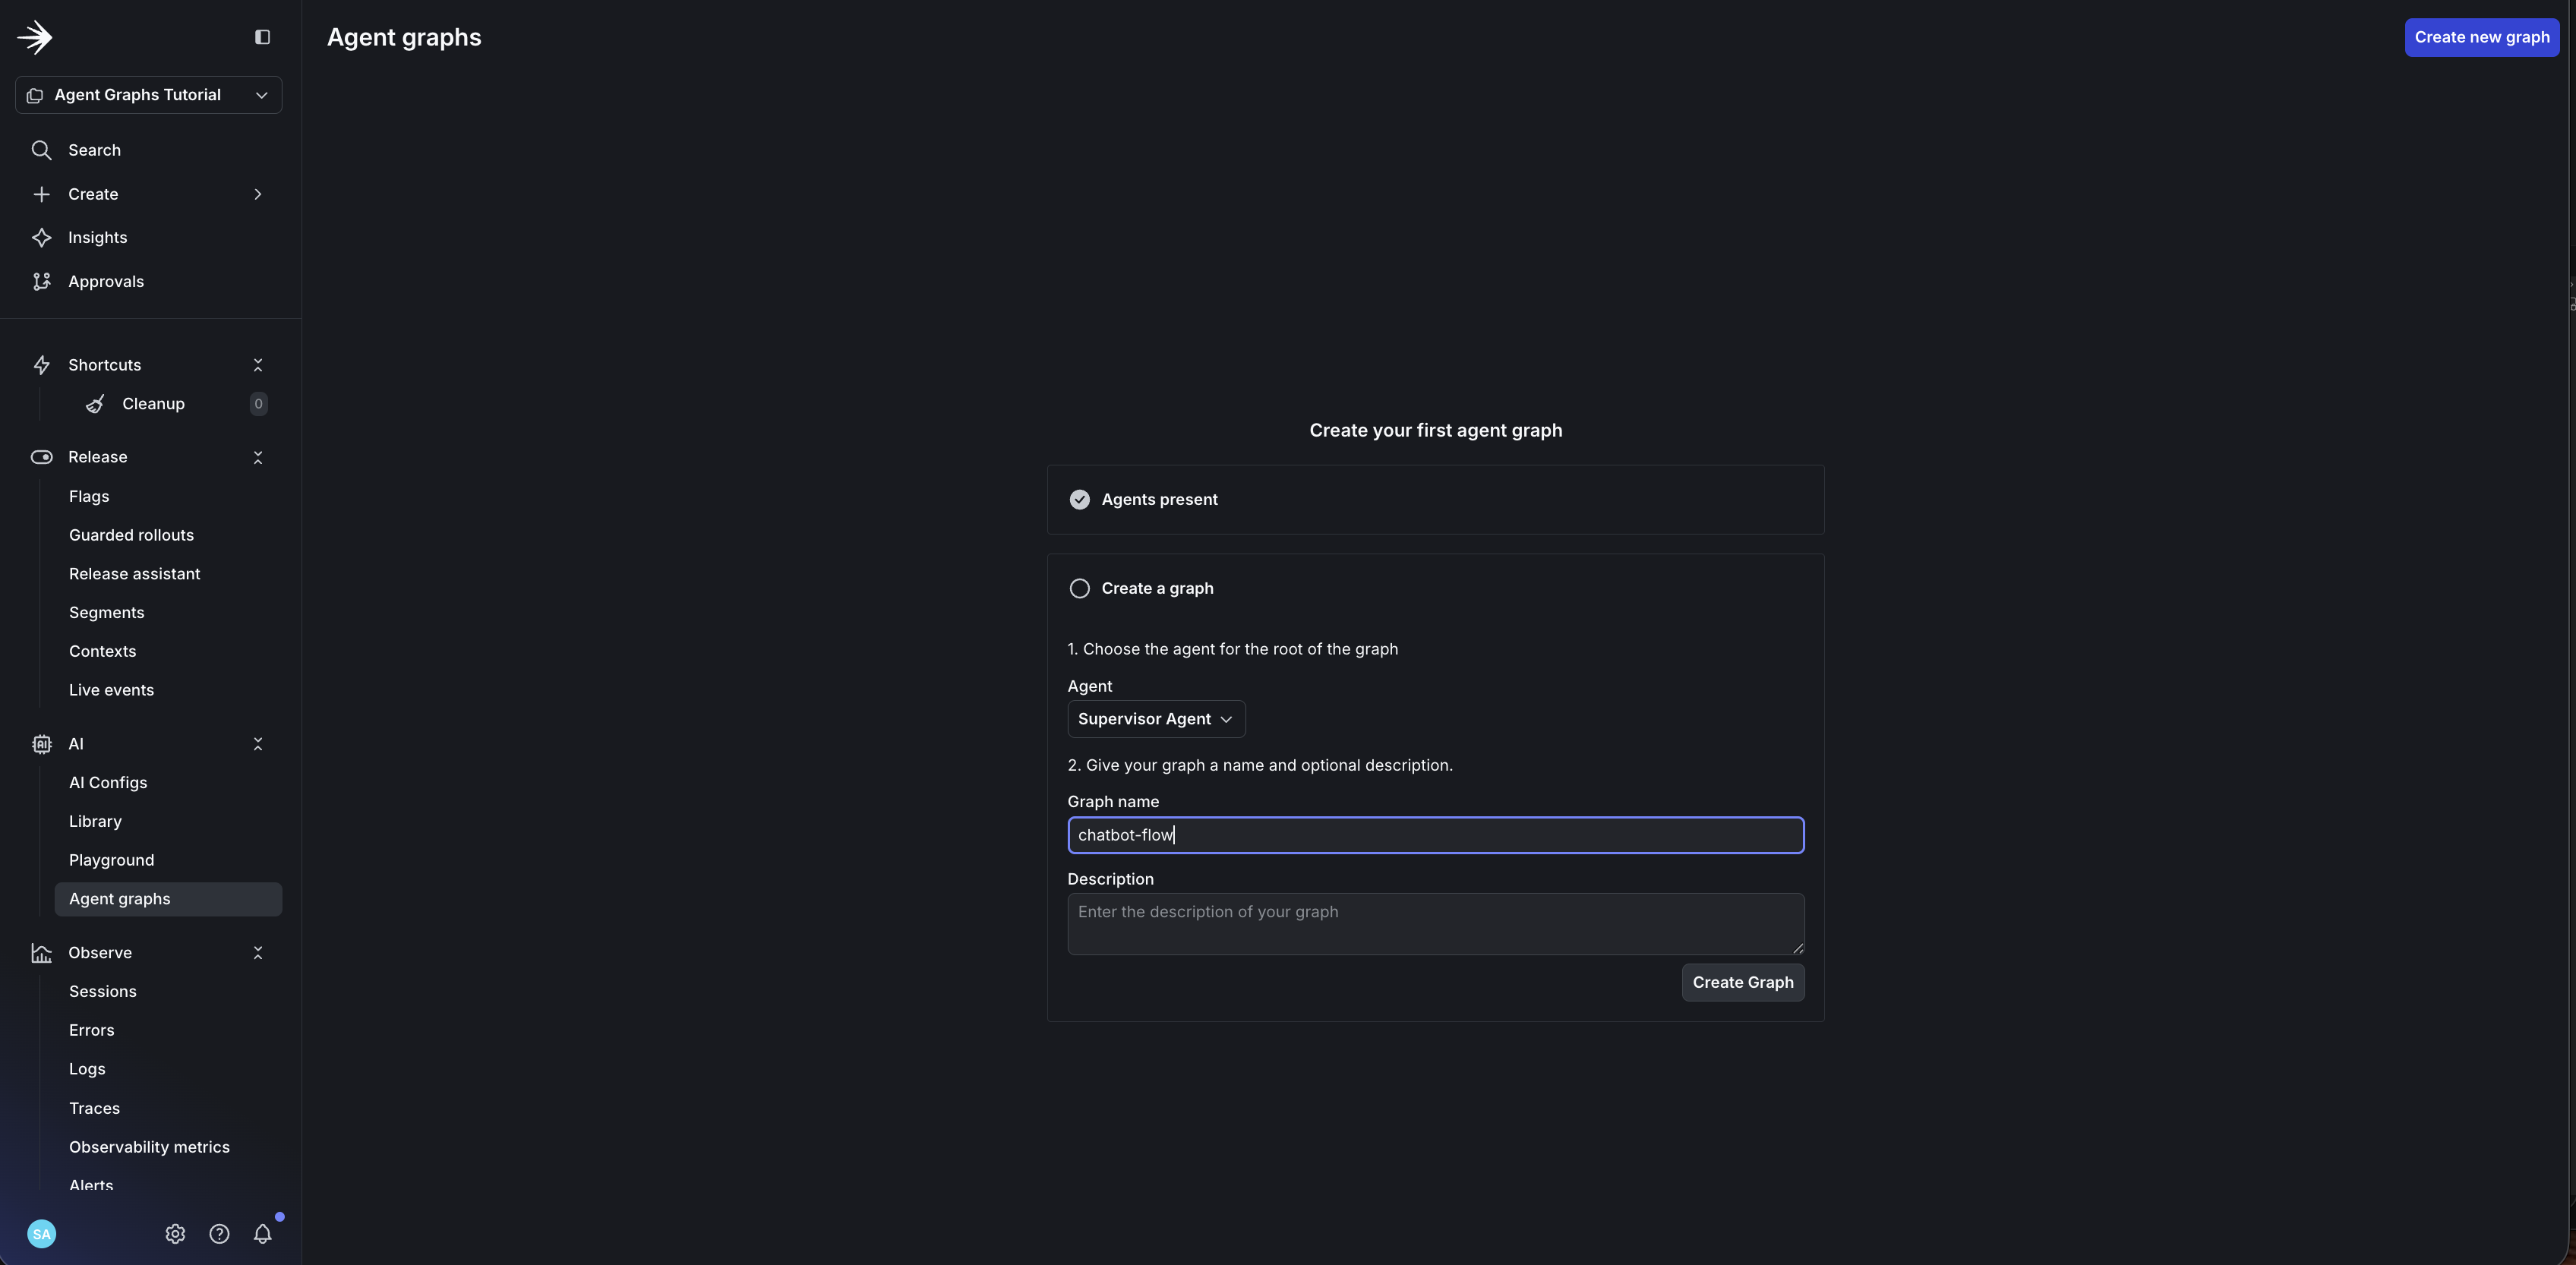
- Name your graph
chatbot-flowand click Create graph.
- Add your first node: click Add node and select
supervisor-agent - Add
security-agentandsupport-agentas nodes
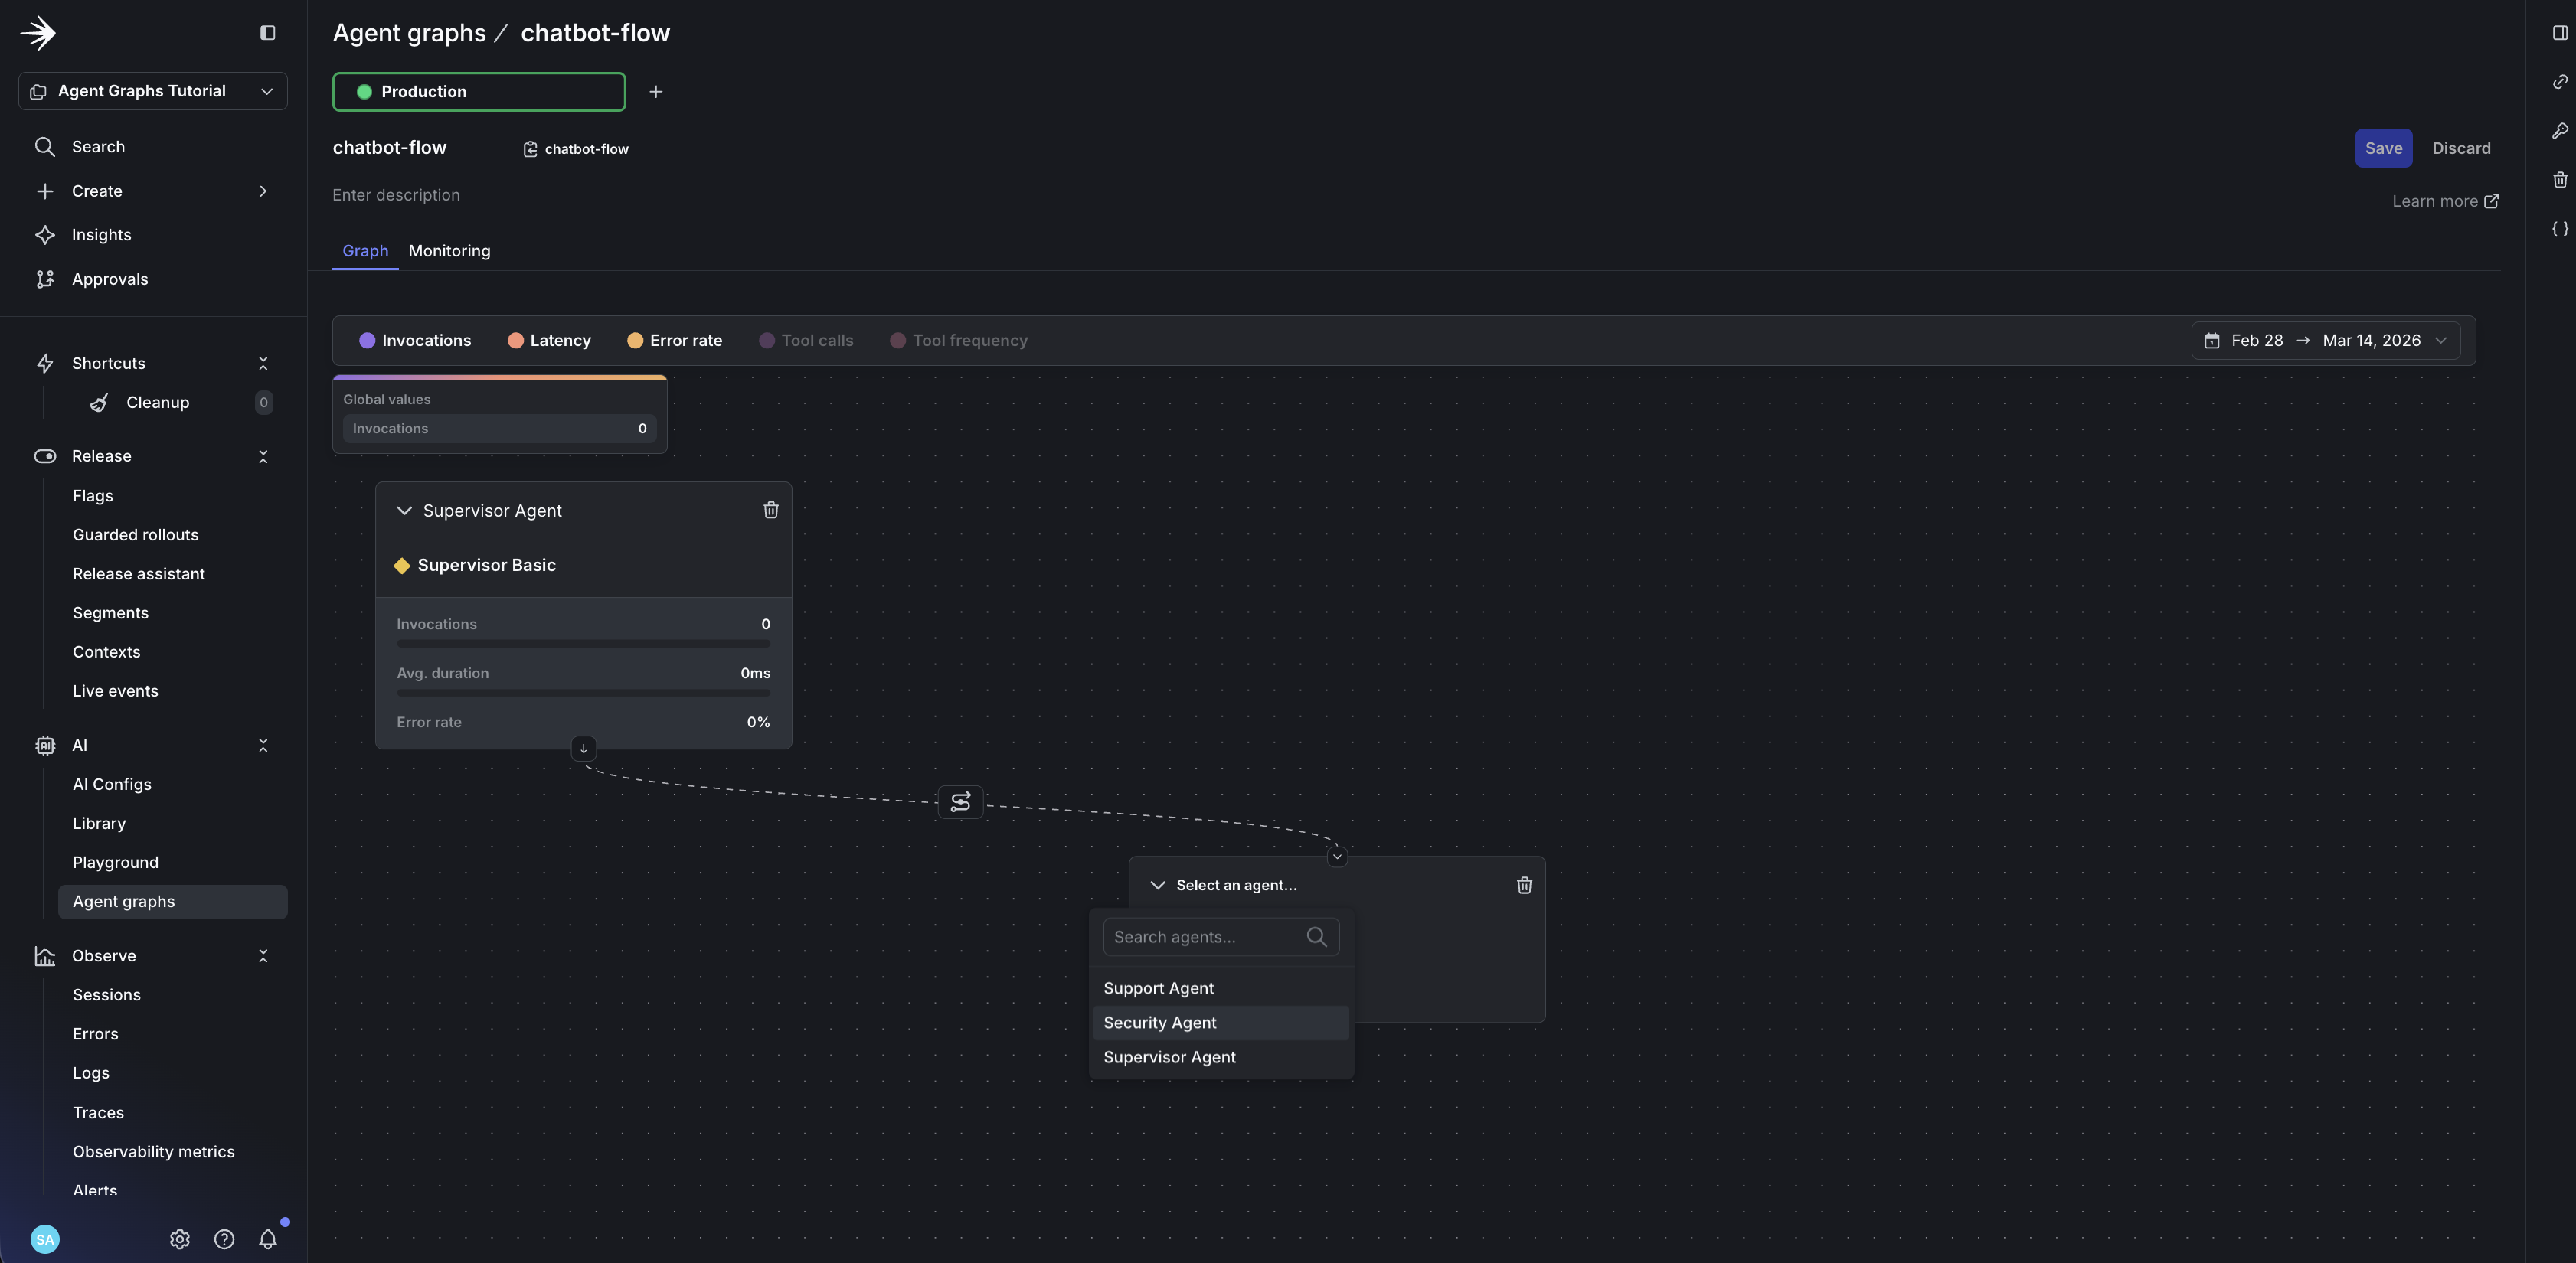
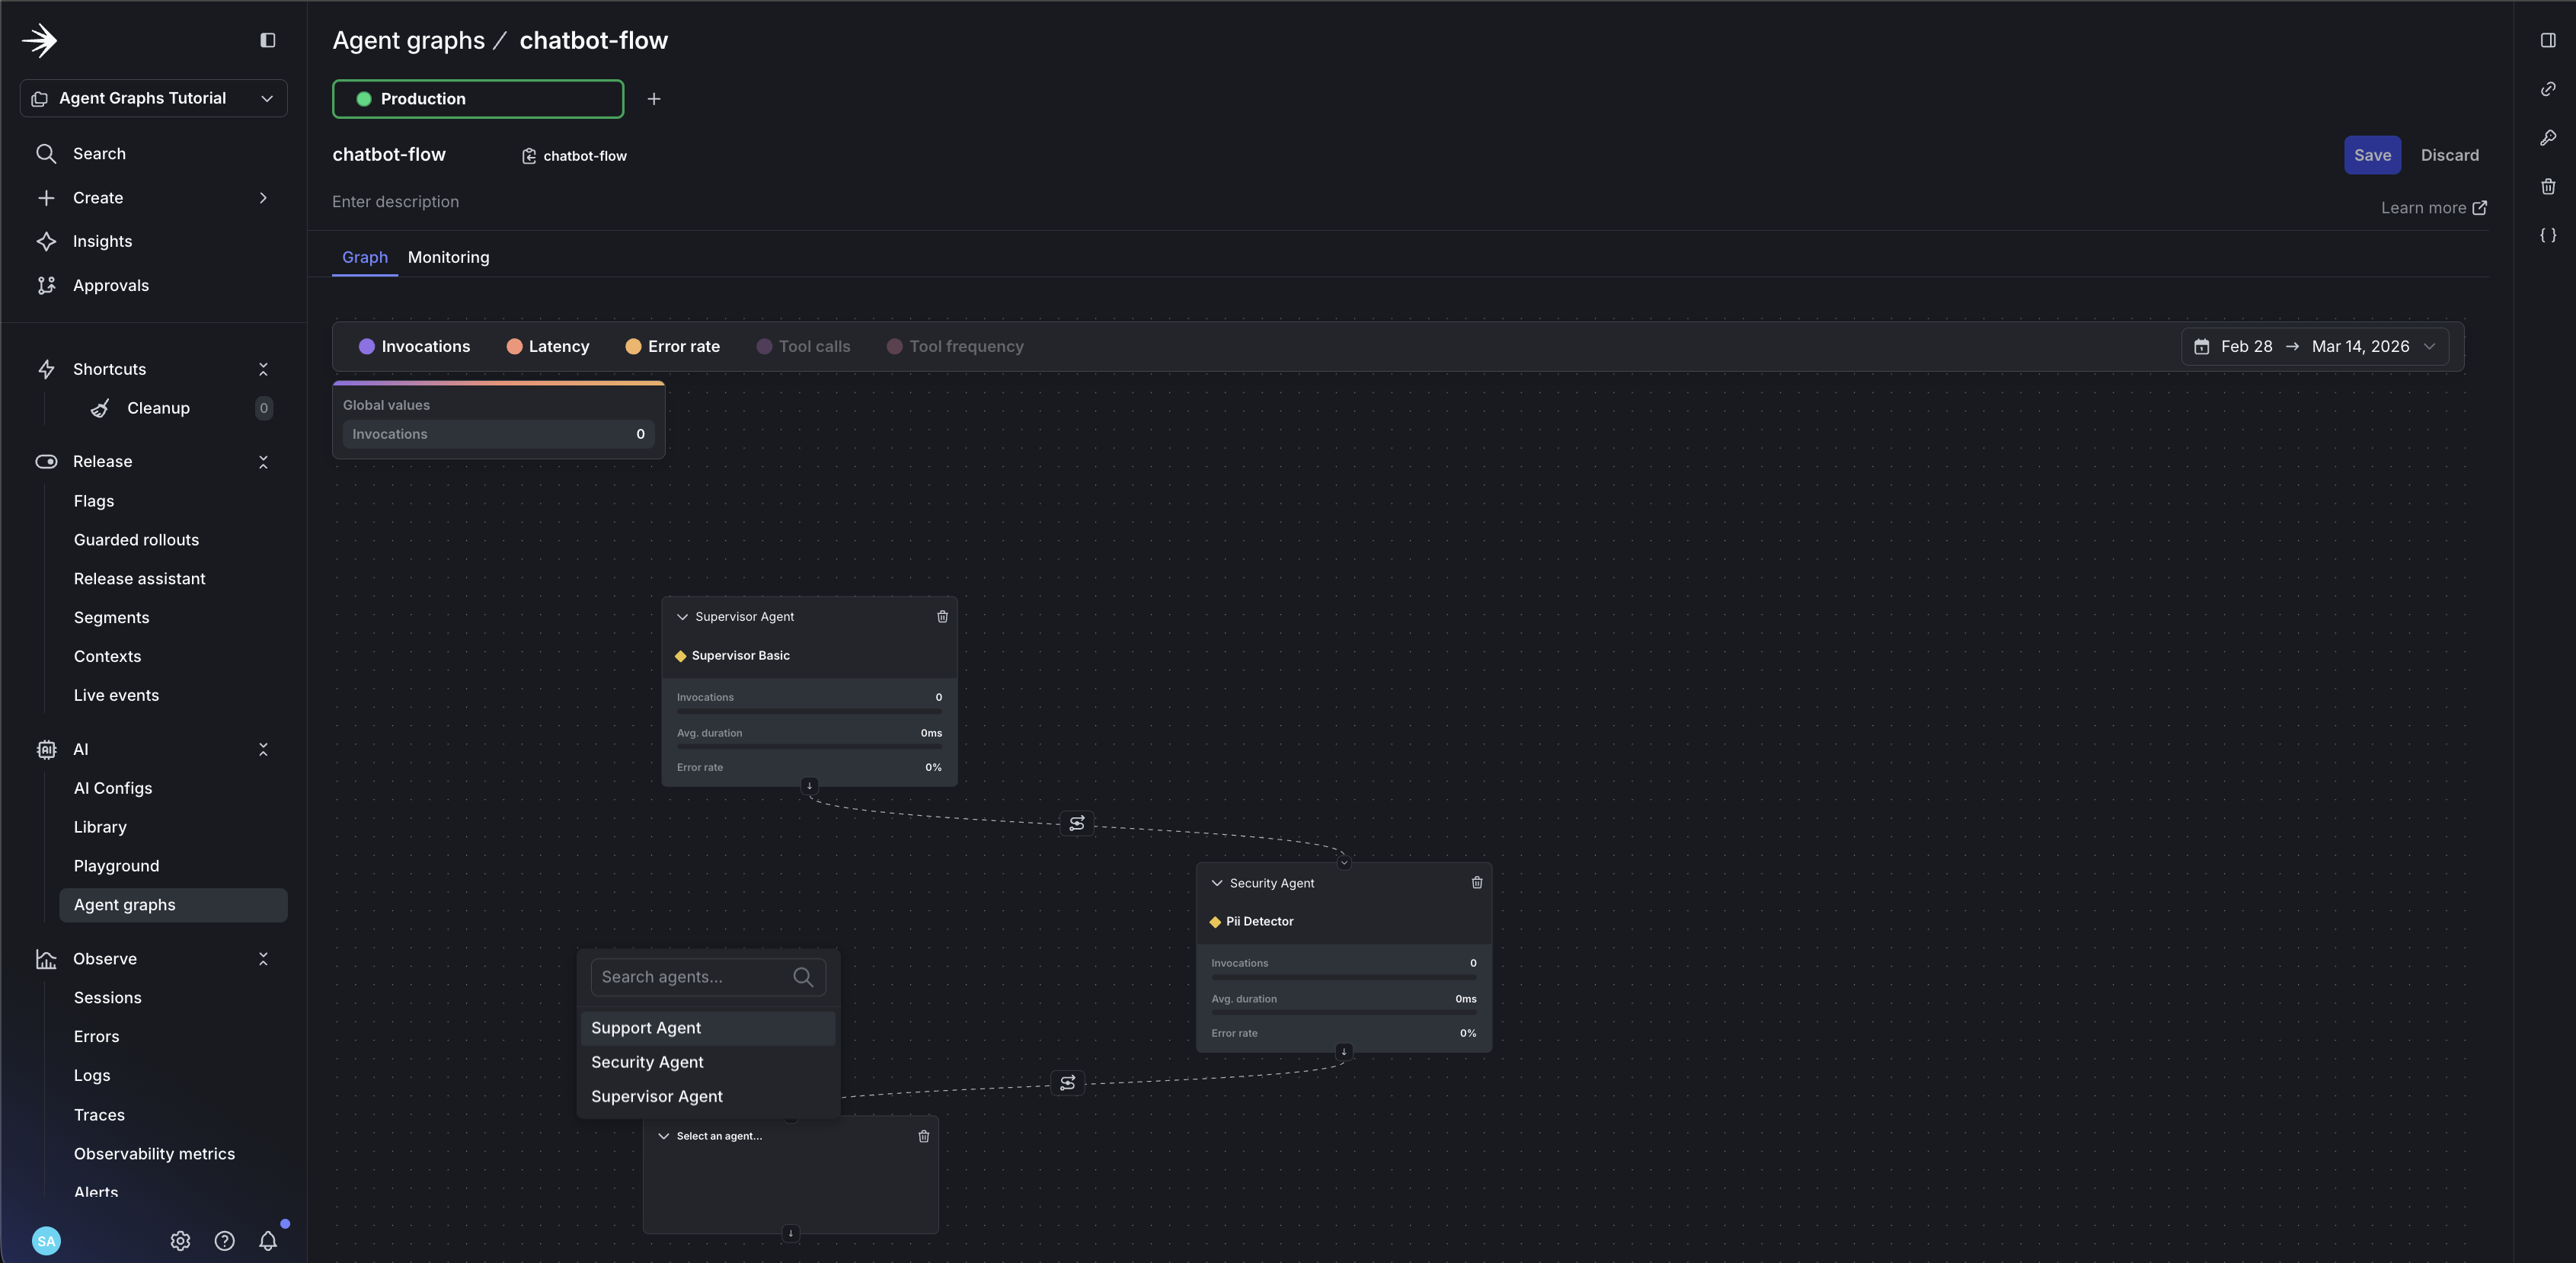
- Draw edges: drag from
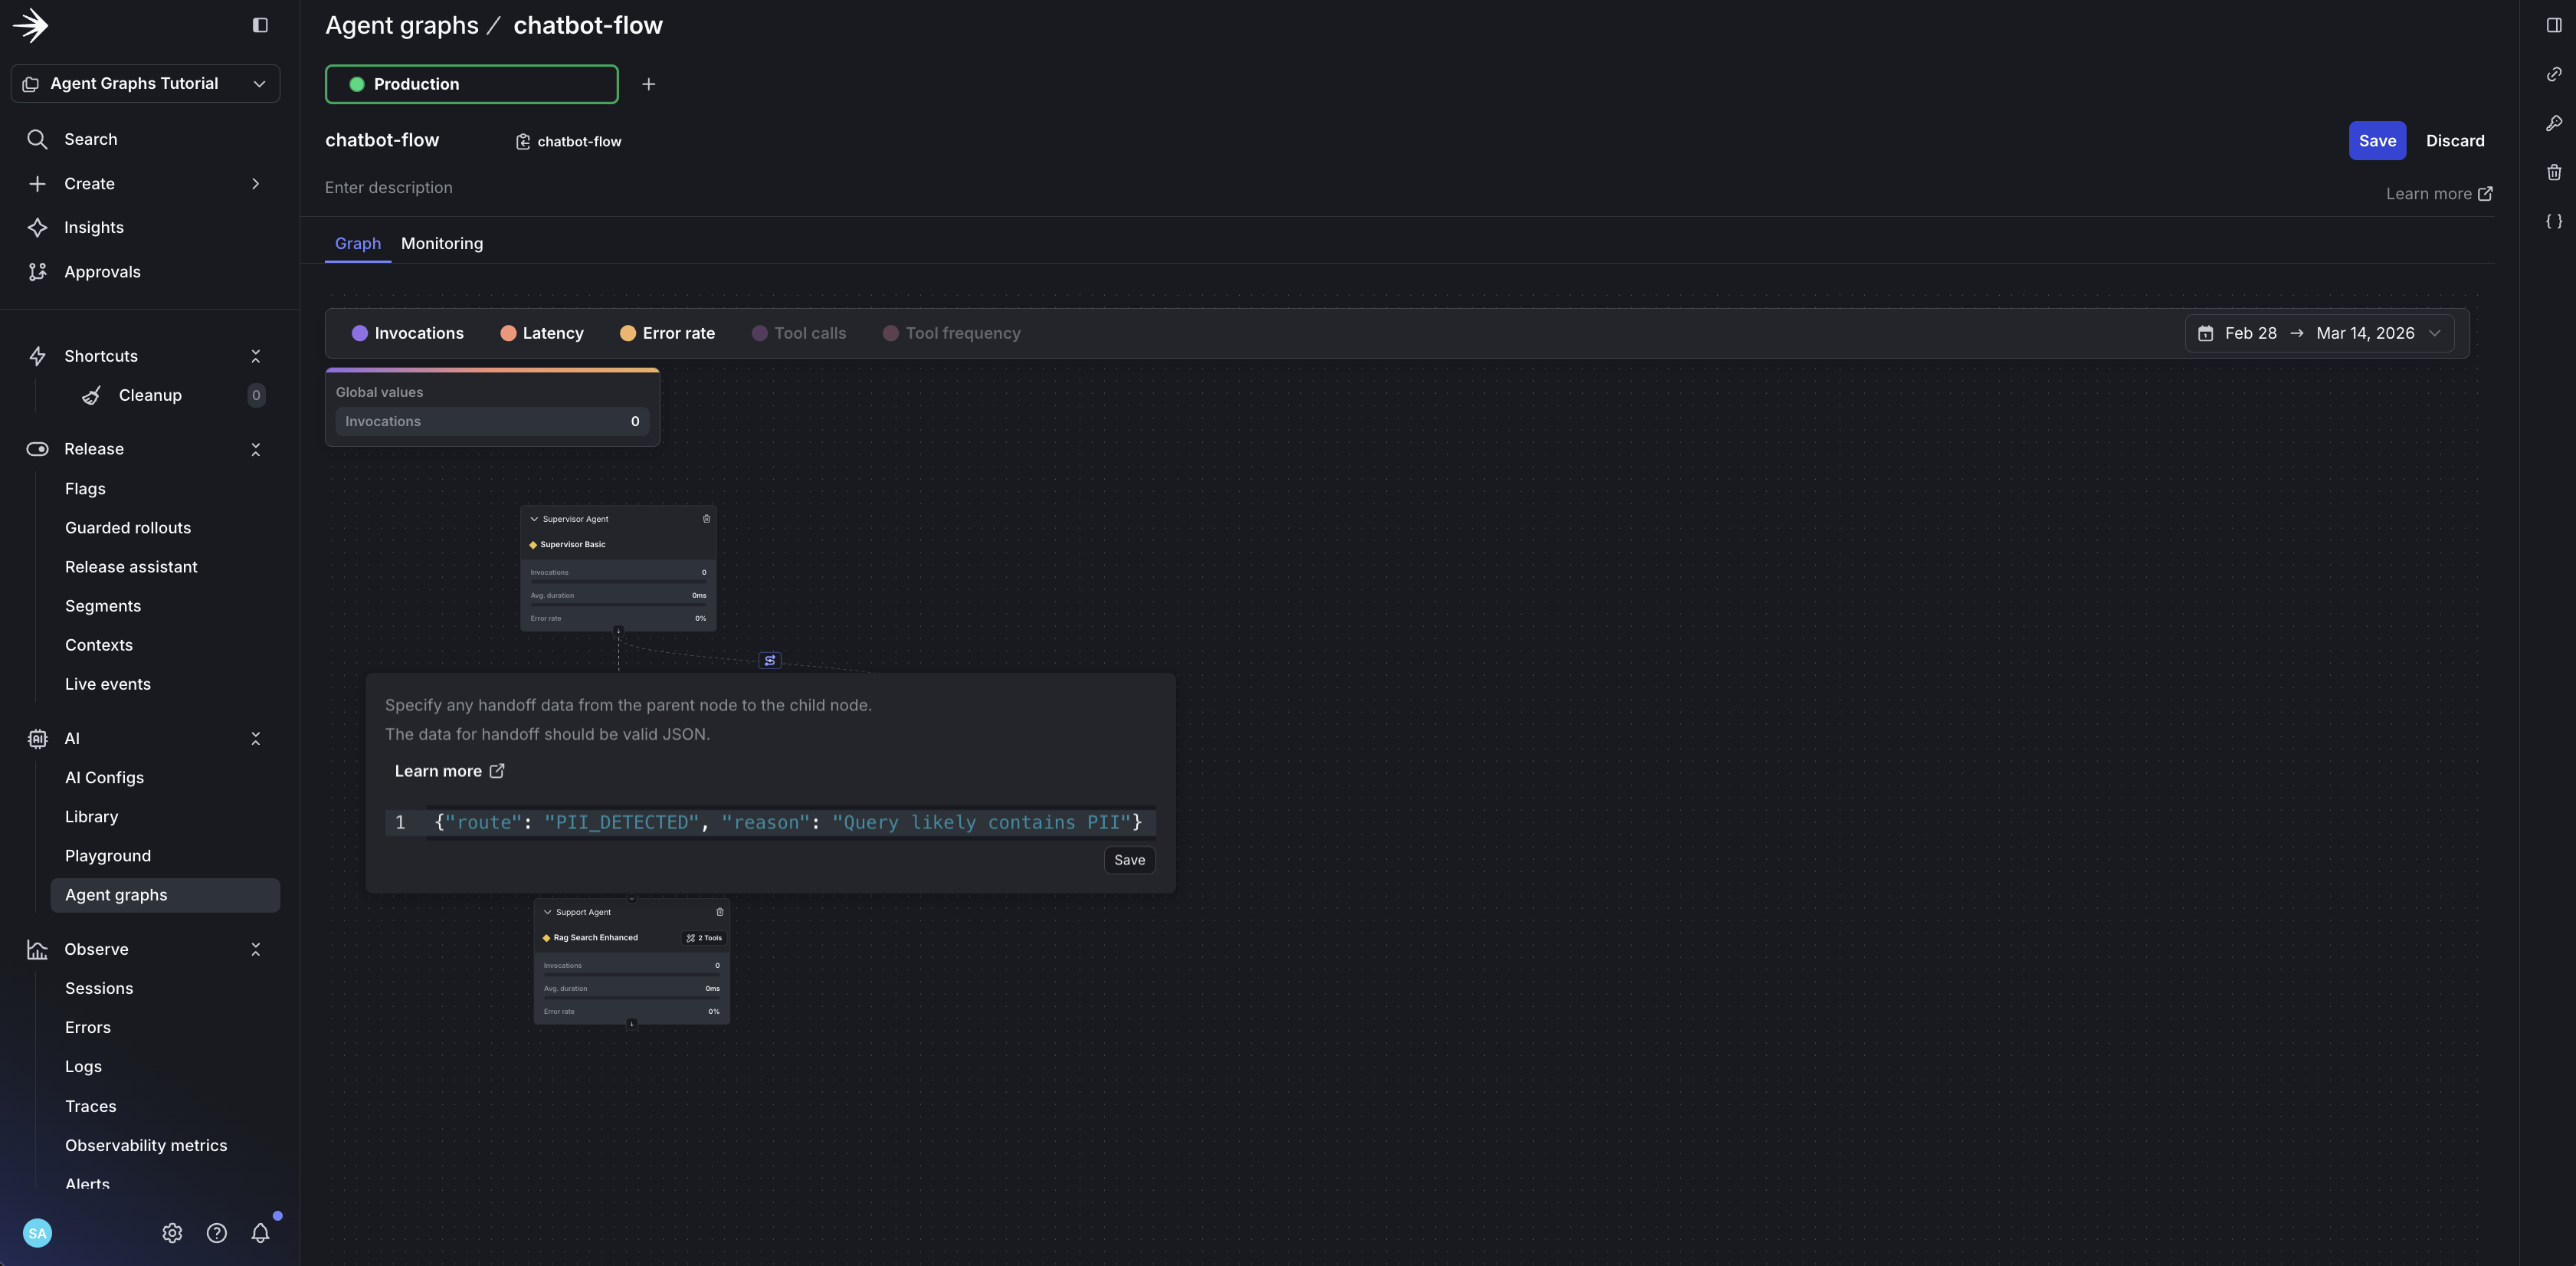
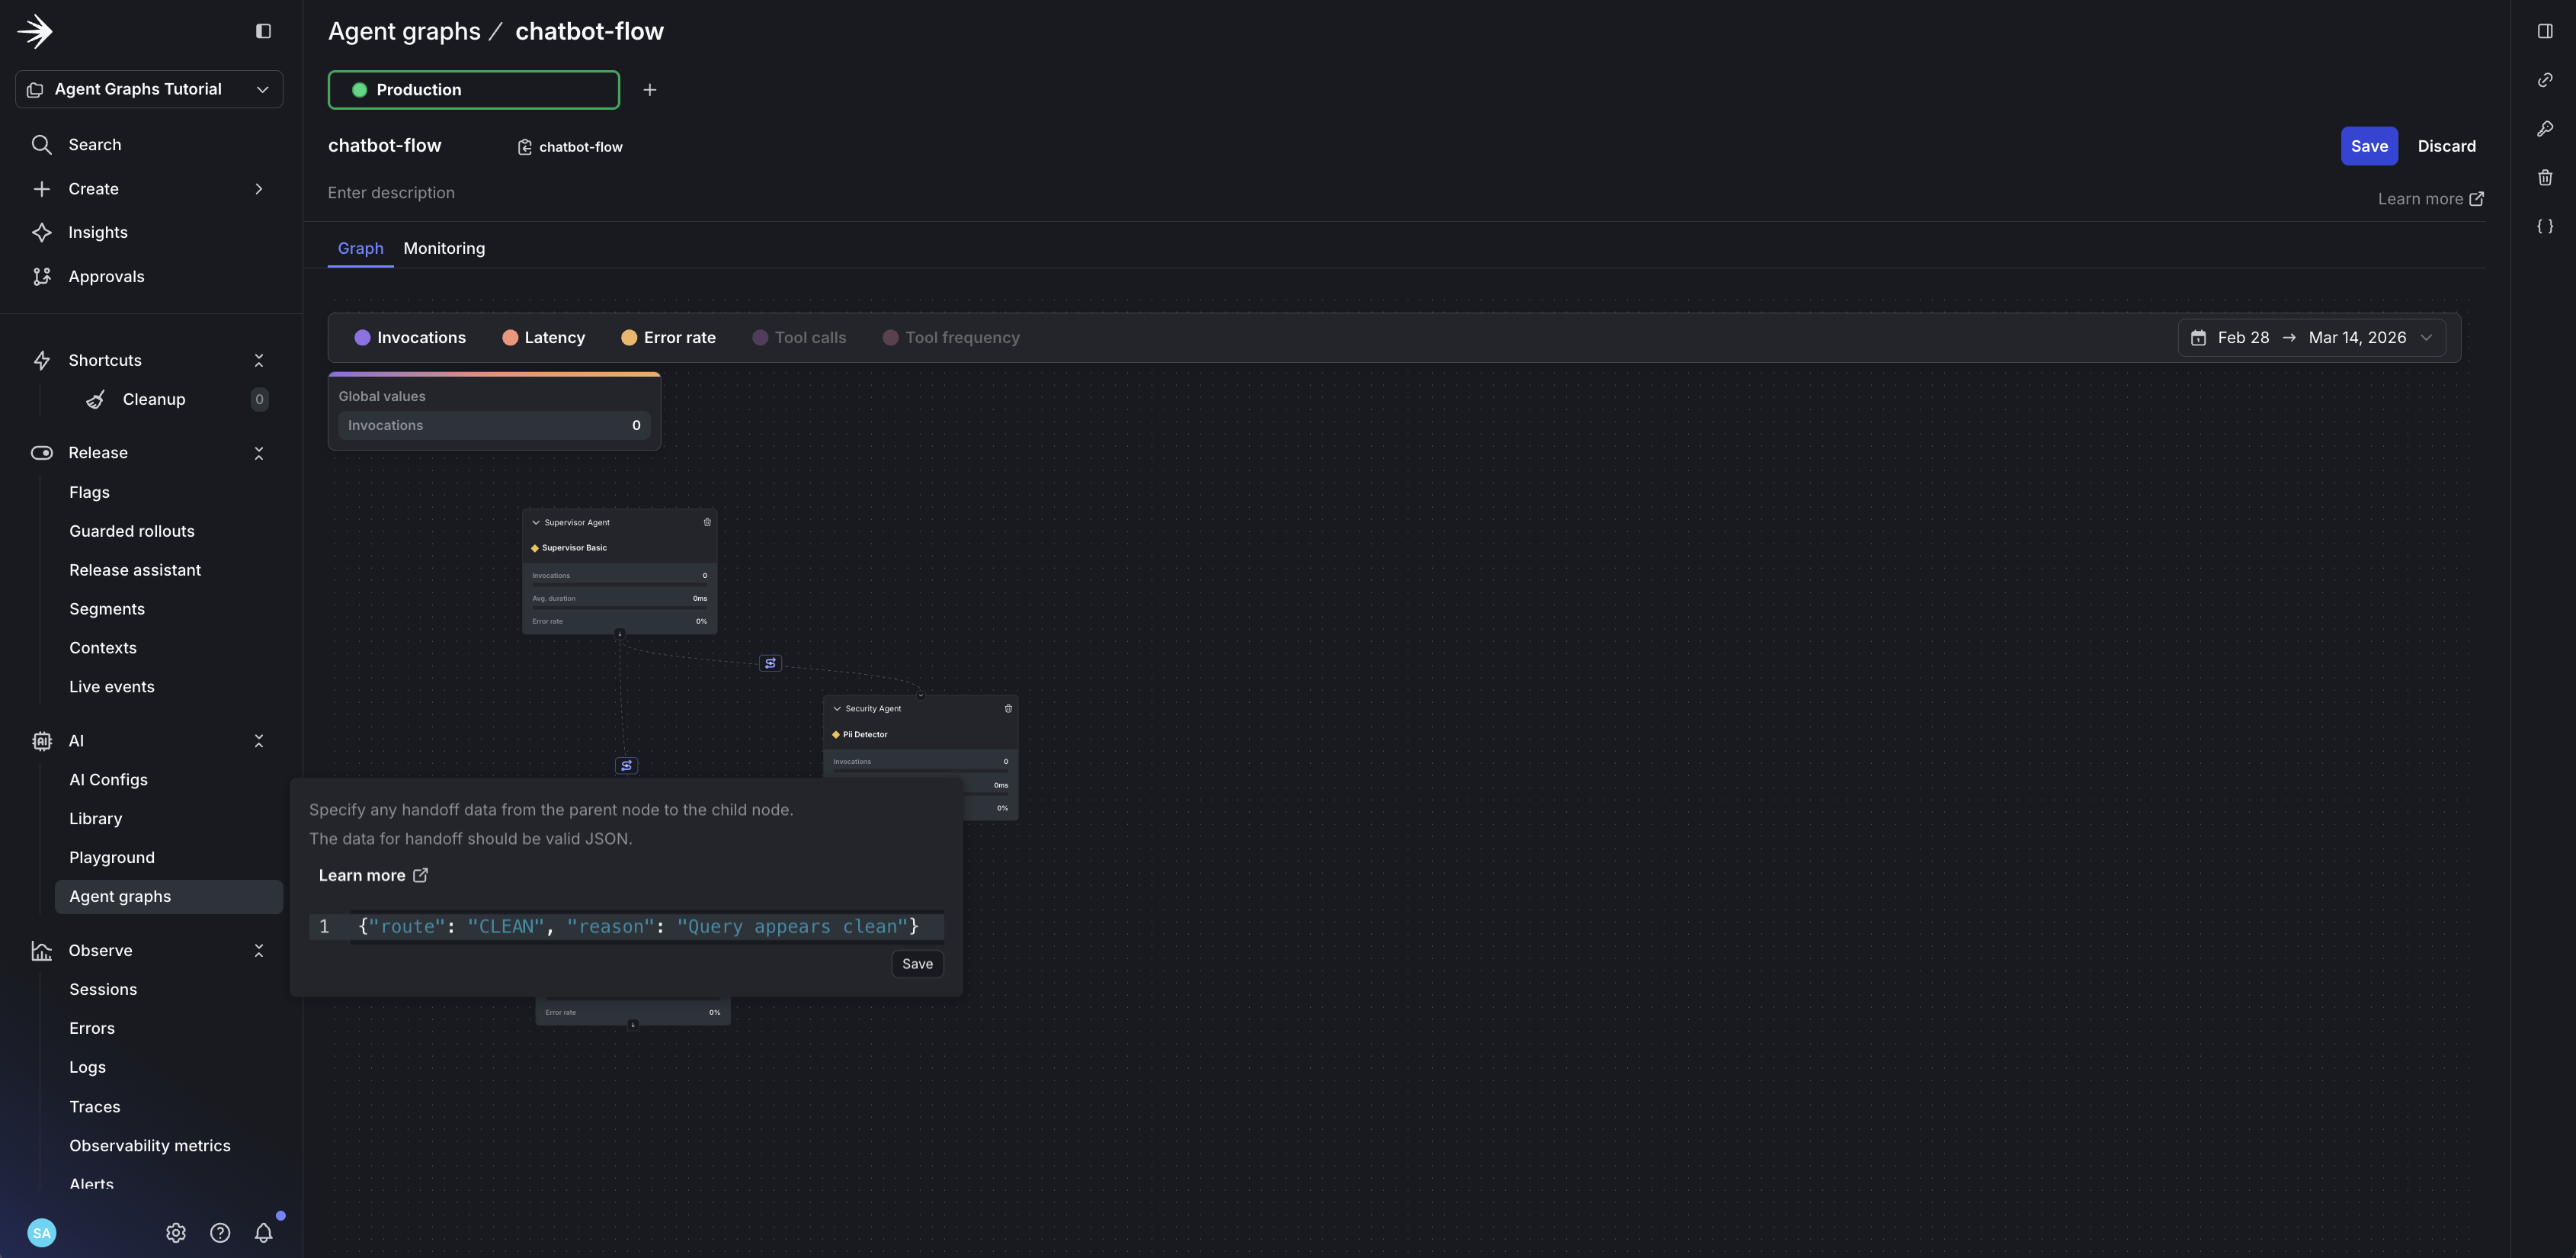
supervisor-agentto both child agents - Add handoff data to each edge to define routing logic:
supervisor-agent → security-agent:
supervisor-agent → support-agent:
security-agent → support-agent:
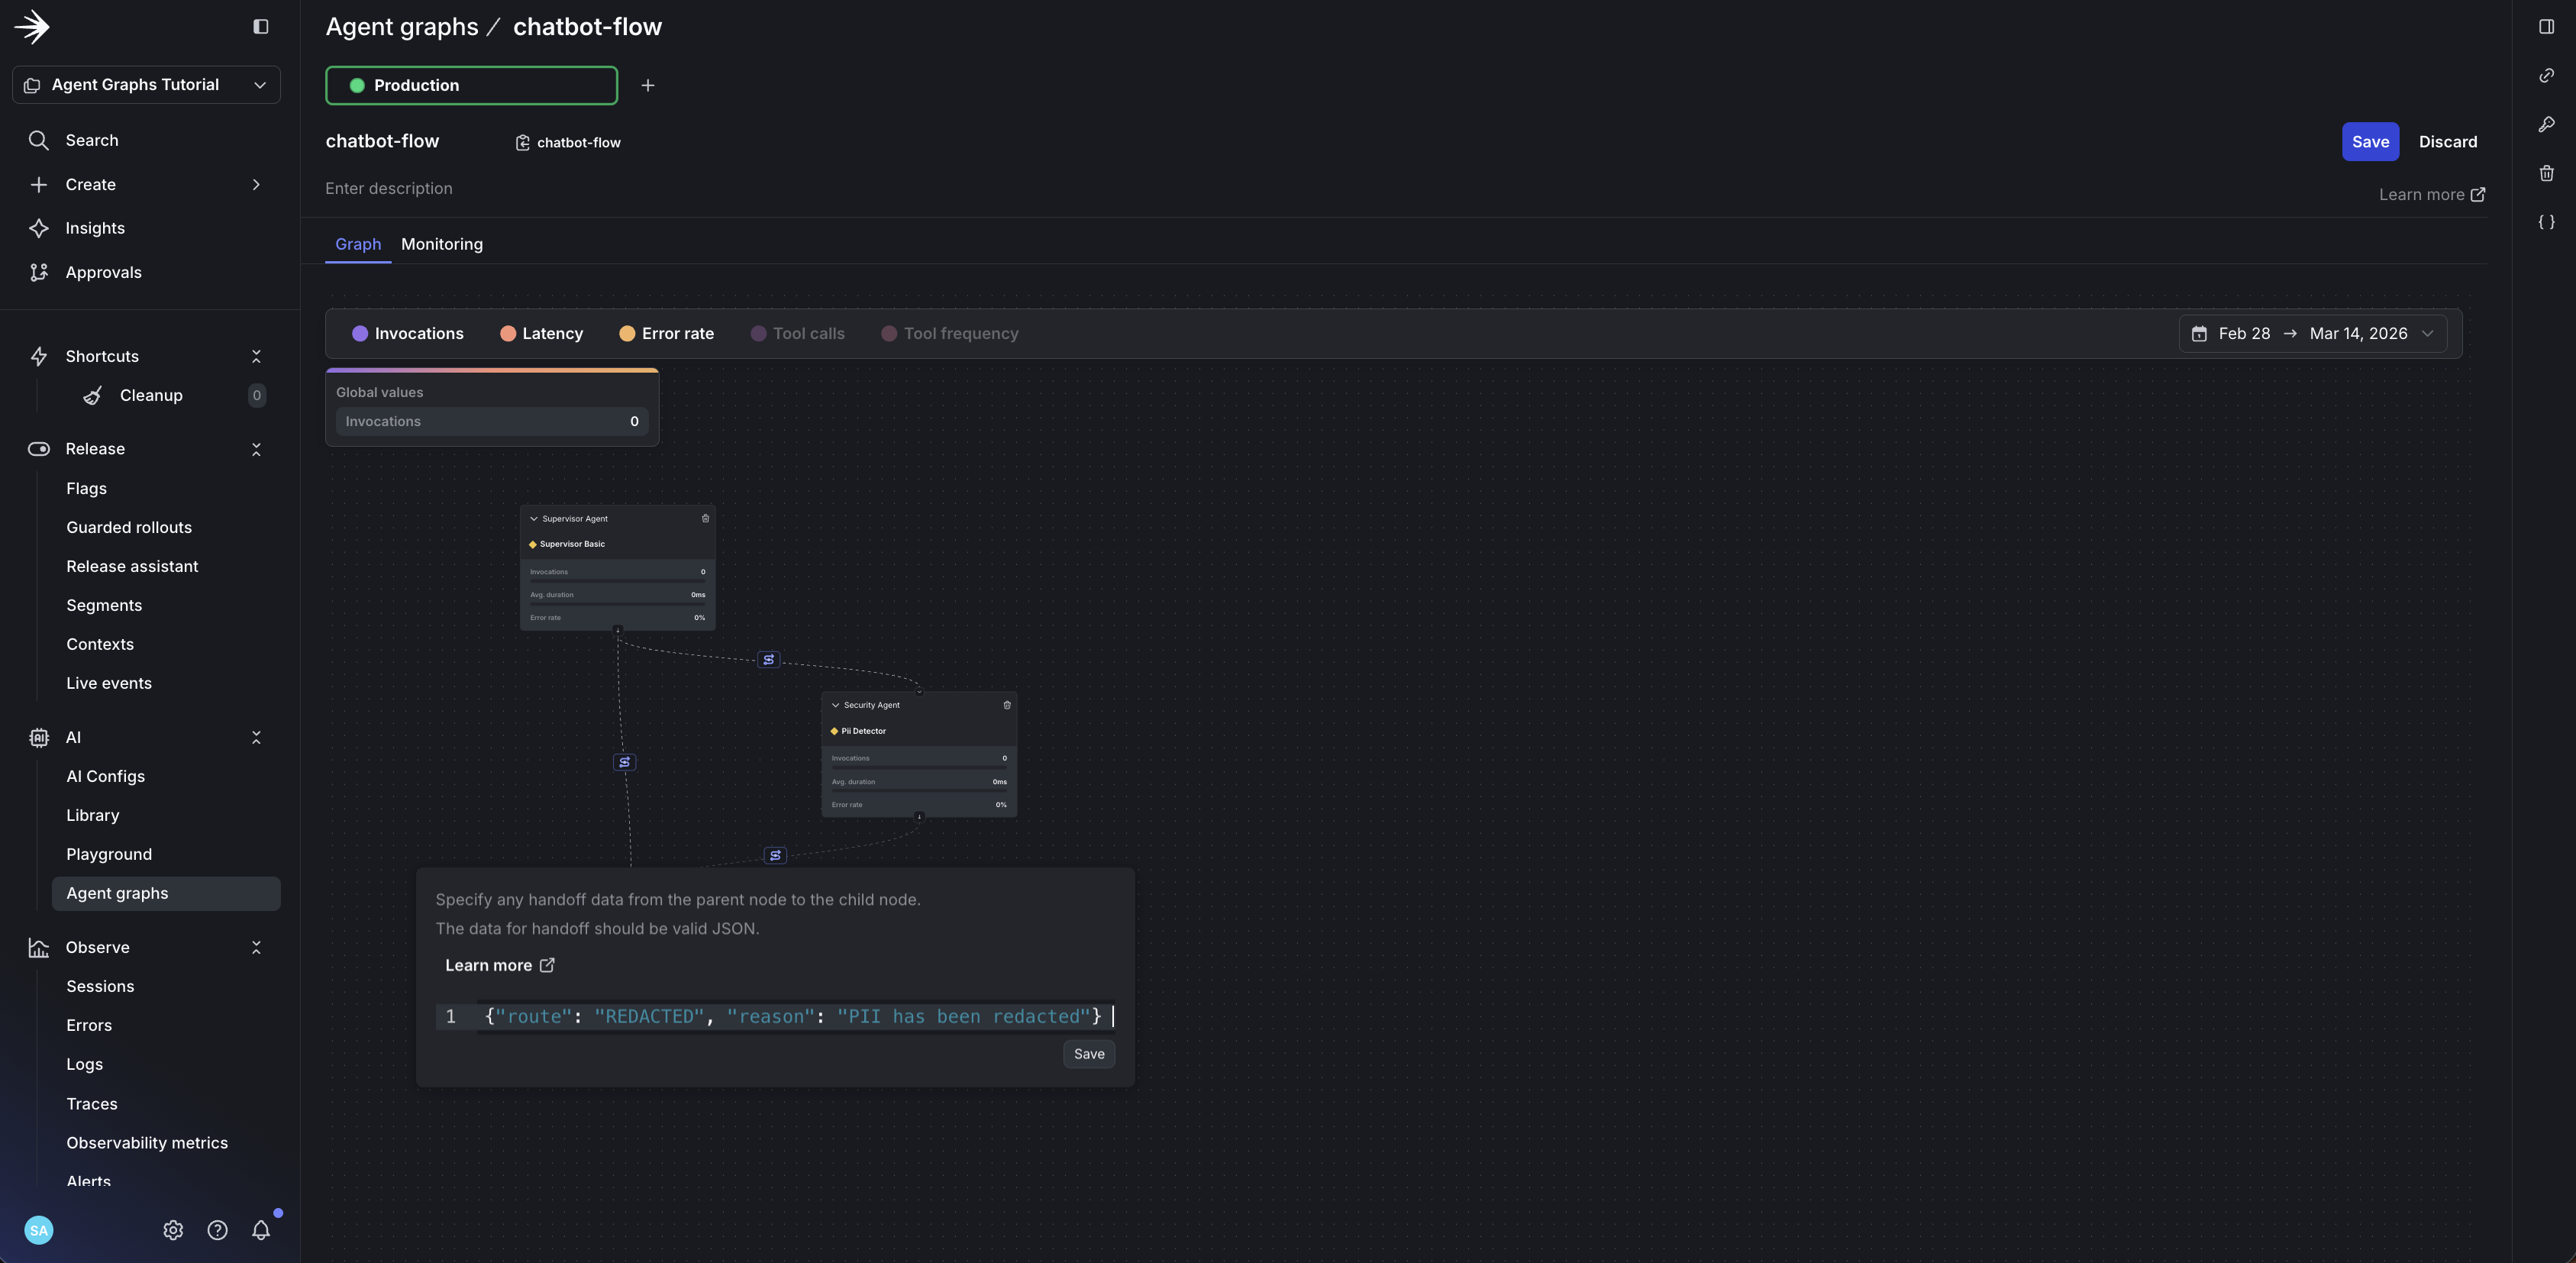
Notice what you’re seeing: the entire workflow topology in one view. This graph is your architecture diagram, always current. Each node shows which config variation it serves. The edges show routing logic that would otherwise be buried in conditional statements. When you need to add a new agent or change routing, you do it here, not in code.
LaunchDarkly doesn’t execute your graph. It provides:
- Topology: Which nodes exist and how they connect
- Handoff metadata: Whatever JSON you put on edges
- Per-node config: Model, instructions, tools for each agent
Your code:
- Decides which edges to follow based on agent decisions
- Interprets handoff data however you want (the schema is yours)
- Executes the actual agents
The handoff JSON is arbitrary metadata. You define the schema, you interpret it. LaunchDarkly stores and delivers it.
Step 3: Add the SDK to your project
Install the LaunchDarkly AI SDK:
Initialize the clients in your code:
Build a context for targeting and tracking:
Step 4: Integrate with your framework
This section walks through the integration code, starting with the building block (what runs at each node), then showing how nodes are orchestrated.
The generic agent pattern
The key to dynamic execution is create_generic_agent. Every node uses the same implementation, with no agent registry and no hardcoded agent types:
The generic agent pattern means:
- No agent registry: Every node uses the same
create_generic_agentfunction - Config-driven behavior: Model, instructions, and tools all come from LaunchDarkly
- Dynamic routing: Valid routes are injected from graph edges, not hardcoded
- Minimal code changes: Add a new agent in LaunchDarkly, create its config, add it to your graph, and it works, provided your runtime supports the node’s tools and output contract
The AgentService class
The AgentService class is the entry point for processing messages through your agent graph:
Executing the graph
The _execute_graph method fetches the graph from LaunchDarkly and uses traverse() with skip logic for conditional routing:
Skip logic for conditional routing
The execute_node callback implements skip logic, the core pattern that enables conditional routing:
The _routed_to set tracks which nodes should execute:
- Start: Add root node to
_routed_to - traverse() visits each node: If node is in
_routed_to, execute it; otherwise skip - After execution: Add the next node (based on routing decision) to
_routed_to
This enables conditional routing: the supervisor routes to either security OR support, and only the chosen path executes.
Routing between nodes
The _select_next_node method determines which node to route to based on the agent’s routing decision:
The key insight: your graph topology comes from LaunchDarkly, not hardcoded orchestration. Change the graph in the UI, and your code picks up the new structure on the next request.
Step 5: Run it
With the AgentService wired up (as shown in Step 4), you can now process messages through your agent graph. The service handles:
- Building the LaunchDarkly context for targeting
- Fetching the graph and executing nodes via
traverse() - Tracking metrics for monitoring
- Returning the final response
Test it by sending a message:
Now go back to the LaunchDarkly UI. Add a new node or change an edge. Run your code again. Topology changes are picked up by your traversal code on subsequent SDK evaluations.
Step 6: Monitor agent performance
This is the key differentiator: monitoring happens on the graph itself, not in a separate view. You see metrics overlaid on the same visual topology you built, so bottlenecks are immediately obvious.
The sample repo includes full instrumentation: calls to tracker.track_success(), tracker.track_error(), and tracker.track_tool_call() in the agent execution path. After running some traffic, open your agent graph to view the results.
Navigate to AI > Agent graphs > chatbot-flow. A metrics bar at the top of the graph view lets you toggle different metrics on and off.
Metrics on the graph
Here’s what makes this different from traditional APM: the metrics appear directly on your workflow visualization. No mental mapping between a separate view and your code. No correlating trace IDs. The slow node lights up on the graph.
Turn on Latency to see duration data overlaid directly on your graph:
- Total duration: The combined time for the entire graph invocation
- Per-node duration: How long each individual agent takes
Turn on Invocations to see how often each node is reached. This reveals which paths your users take most frequently. In a routing graph, you’ll quickly see whether most queries go through security or skip directly to support.
Turn on Tool calls to view the average number of tool invocations per node. If an agent is calling tools excessively, you’ll spot it here.
Monitoring page
Click Monitoring to see all metrics over time. This view shows:
- Latency trends: Duration per node over hours, days, or weeks
- Invocation patterns: Traffic flow through your graph
- Tool call breakdown: Which specific tools are being called and how often
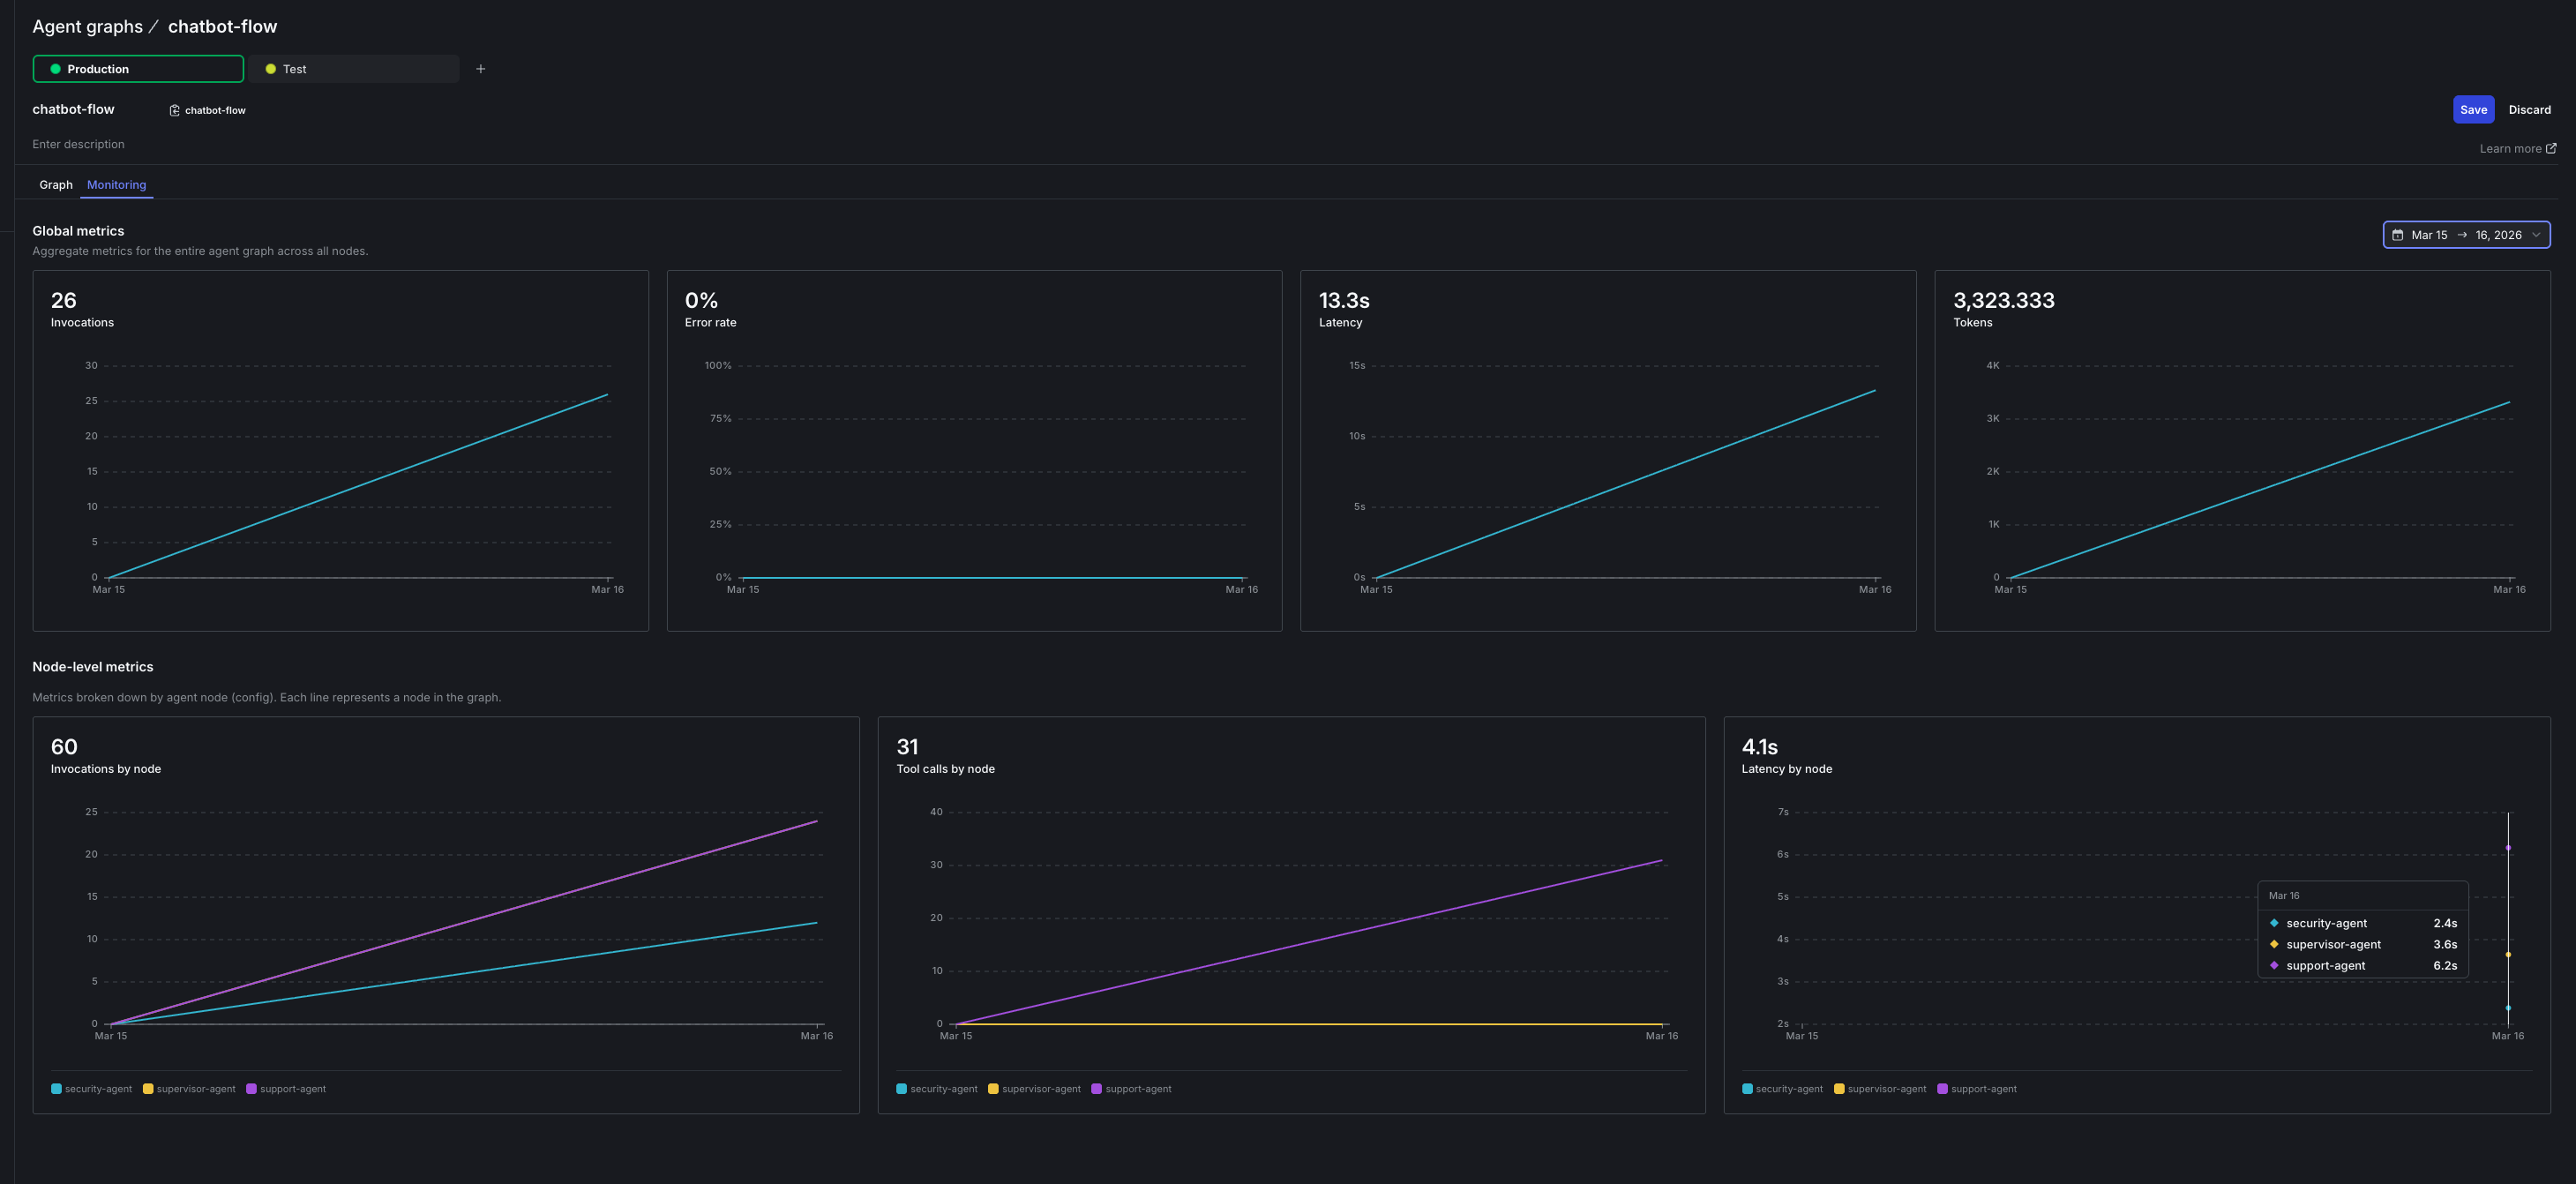
To see which specific tools are called, you need to track them in your code using the tracker. The SDK sends this data to LaunchDarkly, which displays it in the monitoring view.
Generate traffic to see metrics
Run the traffic generator from the sample repo to send queries through your graph:
This sends a mix of queries (some with PII, some without) to exercise both the security and support paths. After a few minutes, you’ll see metrics populate on the graph.
Detecting a slow agent
With traffic flowing, suppose the security-agent starts averaging 5 seconds per call. With latency metrics enabled on the graph, you see it immediately: the security-agent node shows a high duration value while other nodes stay fast.
The invocation numbers also tell a story. If security-agent shows 50 invocations and support-agent shows 80, you know ~30 queries are bypassing security (the clean path). This helps you understand whether the slow agent is affecting most users or just a subset.
Without agent graphs, you’d need custom logging, Datadog queries, and manual correlation. With agent graphs, you spot the problem in 30 seconds.
Step 7: Fix without deploying
The security-agent is slow because it’s using claude-sonnet-4-6 for PII detection. A smaller, faster model may be sufficient for this task.
In the LaunchDarkly UI, update the security-agent variation:
- Change model from
Anthropic.claude-sonnet-4-6toAnthropic.claude-haiku-4-5-20251001
Or use Agent Skills to make the change from your coding assistant:
No code changes. No deploy. Changes are picked up on subsequent SDK evaluations.
Run the traffic generator again and watch the latency drop.
What just happened
- Traffic generator sent queries through the graph
- Monitoring showed the slow agent on the graph
- Model swap happened in the UI (or via Agent Skills)
- Your code automatically used the new configuration
No deploys. No PRs. The fix is live.
OpenAI Agents SDK integration (conceptual)
Agent graphs work with multiple frameworks. This conceptual example shows how the pattern translates to OpenAI Agents SDK:
Same graph definition, adapted to each framework’s execution model. The topology metadata lives in LaunchDarkly; your code interprets and executes it.
Best practices
Start simple: Begin with a linear graph (A → B → C) before adding conditional routing.
Use handoff data for context passing: Include metadata like action type, reason, or state that the next agent needs to continue the workflow.
Track everything: Call tracker.track_success() and tracker.track_error() in every node for complete visibility. Use node.get_config().create_tracker().track_tool_call(tool_name) to track which tools agents invoke.
Test with targeting: Use LaunchDarkly targeting to route test users to experimental graph configurations.
Handle missing edges: Decide what happens when no edge matches a routing decision or when you turn off a target node. Recommend: fail closed, log diagnostics, and track routing failures.
Keep execution state request-scoped: Store execution state inside the context object (ctx) passed through traversal, not in instance-level variables. Treat graph traversal as request-scoped to avoid concurrency issues.
What you’ve built
You now have a multi-agent system where:
- Graph topology is externalized and self-documenting
- Routing logic is visible on edges, not buried in code
- Monitoring appears on the graph itself, not a separate view
- Node-level control lets you disable a single agent without touching others, provided your executor checks node availability
- Multiple frameworks can consume the same graph metadata
When you spot a slow agent in monitoring, swap the model in the LaunchDarkly UI without a deploy.
Next steps
- Agent graphs: SDK methods for
traverse,reverse_traverse,get_edges(), and handoff data - AgentControl documentation: Learn more about variations, targeting, and experiments
- Agent Skills tutorial: Manage configs from your coding assistant
- Monitor config performance: Deep dive into metrics and monitoring views
- Sample repository: Complete code from this tutorial
- Offline Evaluation of RAG-Grounded Answers: Add a regression-testing layer for the graph’s RAG-bearing nodes
- Smart AI Agent Targeting with MCP Tools: Layer plan, geo, and tier targeting on top of your graph variations
- Evaluate LLM code generation with LLM-as-judge evaluators: Attach custom judges to individual nodes for per-agent quality scoring
- Building Framework-Agnostic AI Swarms: Run the same graph topology across LangGraph, Strands, and OpenAI Swarm
- Proving ROI with data-driven AI agent experiments: A/B test graph variations to prove which routing or model choice wins
Conclusion
Hardcoded orchestration was fine when you had one agent. With multi-agent systems, it becomes a liability. Every change requires a deploy. Every incident requires a developer.
Agent graphs flip this. Define your workflow in LaunchDarkly, integrate it with your framework, and fix many problems without touching code. Your agents become as dynamic as your feature flags.
Ready to stop hardcoding? Get started with AgentControl and create your first agent graph.