
What is OpenTelemetry and why should I care?
Published August 7, 2024

OpenTelemetry is a really cool project from the CNCF. In this post, we will cover the origins of OpenTelemetry, also known as OTEL, as well as what it looks like to spin up your own collector. By the end of it, you should have a pretty good understanding about what OpenTelemetry is and how to start collecting OTEL data in your applications. Check out our article on instrumenting a Next.js app to collect OpenTelemetry data and how you can use LaunchDarkly to simplify the process while getting additional insights.
If you would prefer a video of this content, please feel free to check out our YouTube video about the subject.
What’s Missing?
There are several things that we won’t be addressing in this post for the sake of brevity.
- Scaling the collector - We haven’t explained what the collector even is, yet. But the scope of this post won’t cover how you might want to prepare your collector for production-level traffic and usage. OpenTelemetry has an excellent doc on best practices for scaling if that’s something you’re looking to do.```
- Client Setup - Client-side telemetry is still very experimental and most OTEL-compatible services implement their own custom way of handling this. If you are interested in participating in the discovery process please checkout this link.
- User Sessions - OpenTelemetry has the idea of spans and traces, but those are often just a part of a user’s session on your site. LaunchDarkly does a great job of grouping your traces under one session so that you can understand a user’s flow through your whole site rather than just a page or request at a time.
- Logging - The Node SDK lists logs as still being in development, so we will not be digging into them in this article.
OpenTelemetry (OTEL) Basics
OpenTelemetry actually started as a combination of two other CNCF projects, OpenTracing and OpenCensus. As an Incubator project, it is considered stable and used successfully in production environments.
When we talk about “telemetry” in the context of OpenTelemetry, we really mean these core concepts:
- Traces - The “big picture” of a request to your application. Traces are comprised of spans and can help you understand a monolithic application or a mesh of microservices.
- Metrics - A measurement of availability and performance. Metrics help you understand the user experience of your application. This could include measurements like CPU, RAM, and network latency.
- Logs - Timestamped text records with attached metadata. According to the OpenTelemetry website, logs are “any data that is not part of a distributed trace or a metric is a log.”
- Baggage - Contextual information passed between spans. Baggage is useful for passing useful information around such as ClientIDs or user/customer IDs.
Why OpenTelemetry
You might be wondering why OpenTelemetry was created in the first place. Well, the first step is to realize why we need telemetry at all. Most APIs and backend services are a black box. We are only able to see the inputs and outputs. Telemetry allows us to know what is happening on the inside.
The next thing to understand is the world of telemetry before OpenTelemetry existed. Many solutions that don’t interoperate well together. This caused a lot of vendor lock-in. Migrating from one provider to another often involved a lot of custom work. This is work that is not part of your core application and, as such, takes away from the time in which you can ship features and bugfixes to your users.
CNCF?
Earlier we mentioned the CNCF, the Cloud Native Computing Foundation, which is a subsidiary of the Linux Foundation. They are the stewards of the OpenTelemetry project among other things, including Jaeger, containerd, CoreDNS, Helm, Kubernetes, and more.
Started in 2015, OpenTracing was one of their first projects and it consisted of consistent, expressive, vendor-neutral APIs. In 2017, they adopted OpenCensus from Google which was a set of tools/libraries built around tracing and monitoring for various languages. By 2019, the two projects had merged, forming OpenTelemetry. All in all, the OpenTelemetry project is in good hands and has plenty of longevity in it with companies like Google, Red Hat, Twitter, Intel, and IBM backing the CNCF.
More Terms
Before we can really dig into the Next.js specifics, we need to understand a few more terms.
- OTLP (OpenTelemetry Protocol): A specification and set of Protobuf definitions that is used to send data to an OpenTelemetry Collector, typically using gRPC.
- Collector: A vendor-agnostic way to receive, process, and export telemetry data. It’s not 100% necessary but can help you solve some interesting problems you might run into such as retries, batching, encryption, and sensitive data filtering.
- Instrumentation: The wiring of traces, metrics, and logs to your application, libraries, and platforms. There are a few different types of instrumentation.
- Automatic or “zero-code” solutions: This would be something like the auto-instrumentations-node package. It allows you to instrument nodejs libraries like http as well as other packages like Express, Hapi, Fastify, and the aws-sdk without wiring them up yourself.
- Custom or “code-based” solutions: You would use something like the OpenTelemetry API and SDK to instrument your application’s logic.
- Libraries: Many libraries are not instrumented by default, so there is often a need for a separate library to do so. This can be done using wrappers, or library-specific callbacks or sometimes for wrapping proprietary telemetry into the OpenTelemetry model.
Setting Up the Collector
Even though the collector is not 100% necessary, we are going to go through a bit of the process for setting one up. The first step is heading to the github repo and downloading the latest release. However, it’s 264MB, so you probably want to gitignore it and have a script to fetch it. It can be used as a standalone application or as a library in your own code.
One thing to be aware of is that Vercel has created a docker-based dev environment to get up and running quickly. In addition to the collector, the dev environment also spins up instances of Jaeger, Zipkin, and Prometheus. This can be nice to get you started, but setting up your own collector will be a better learning experience.
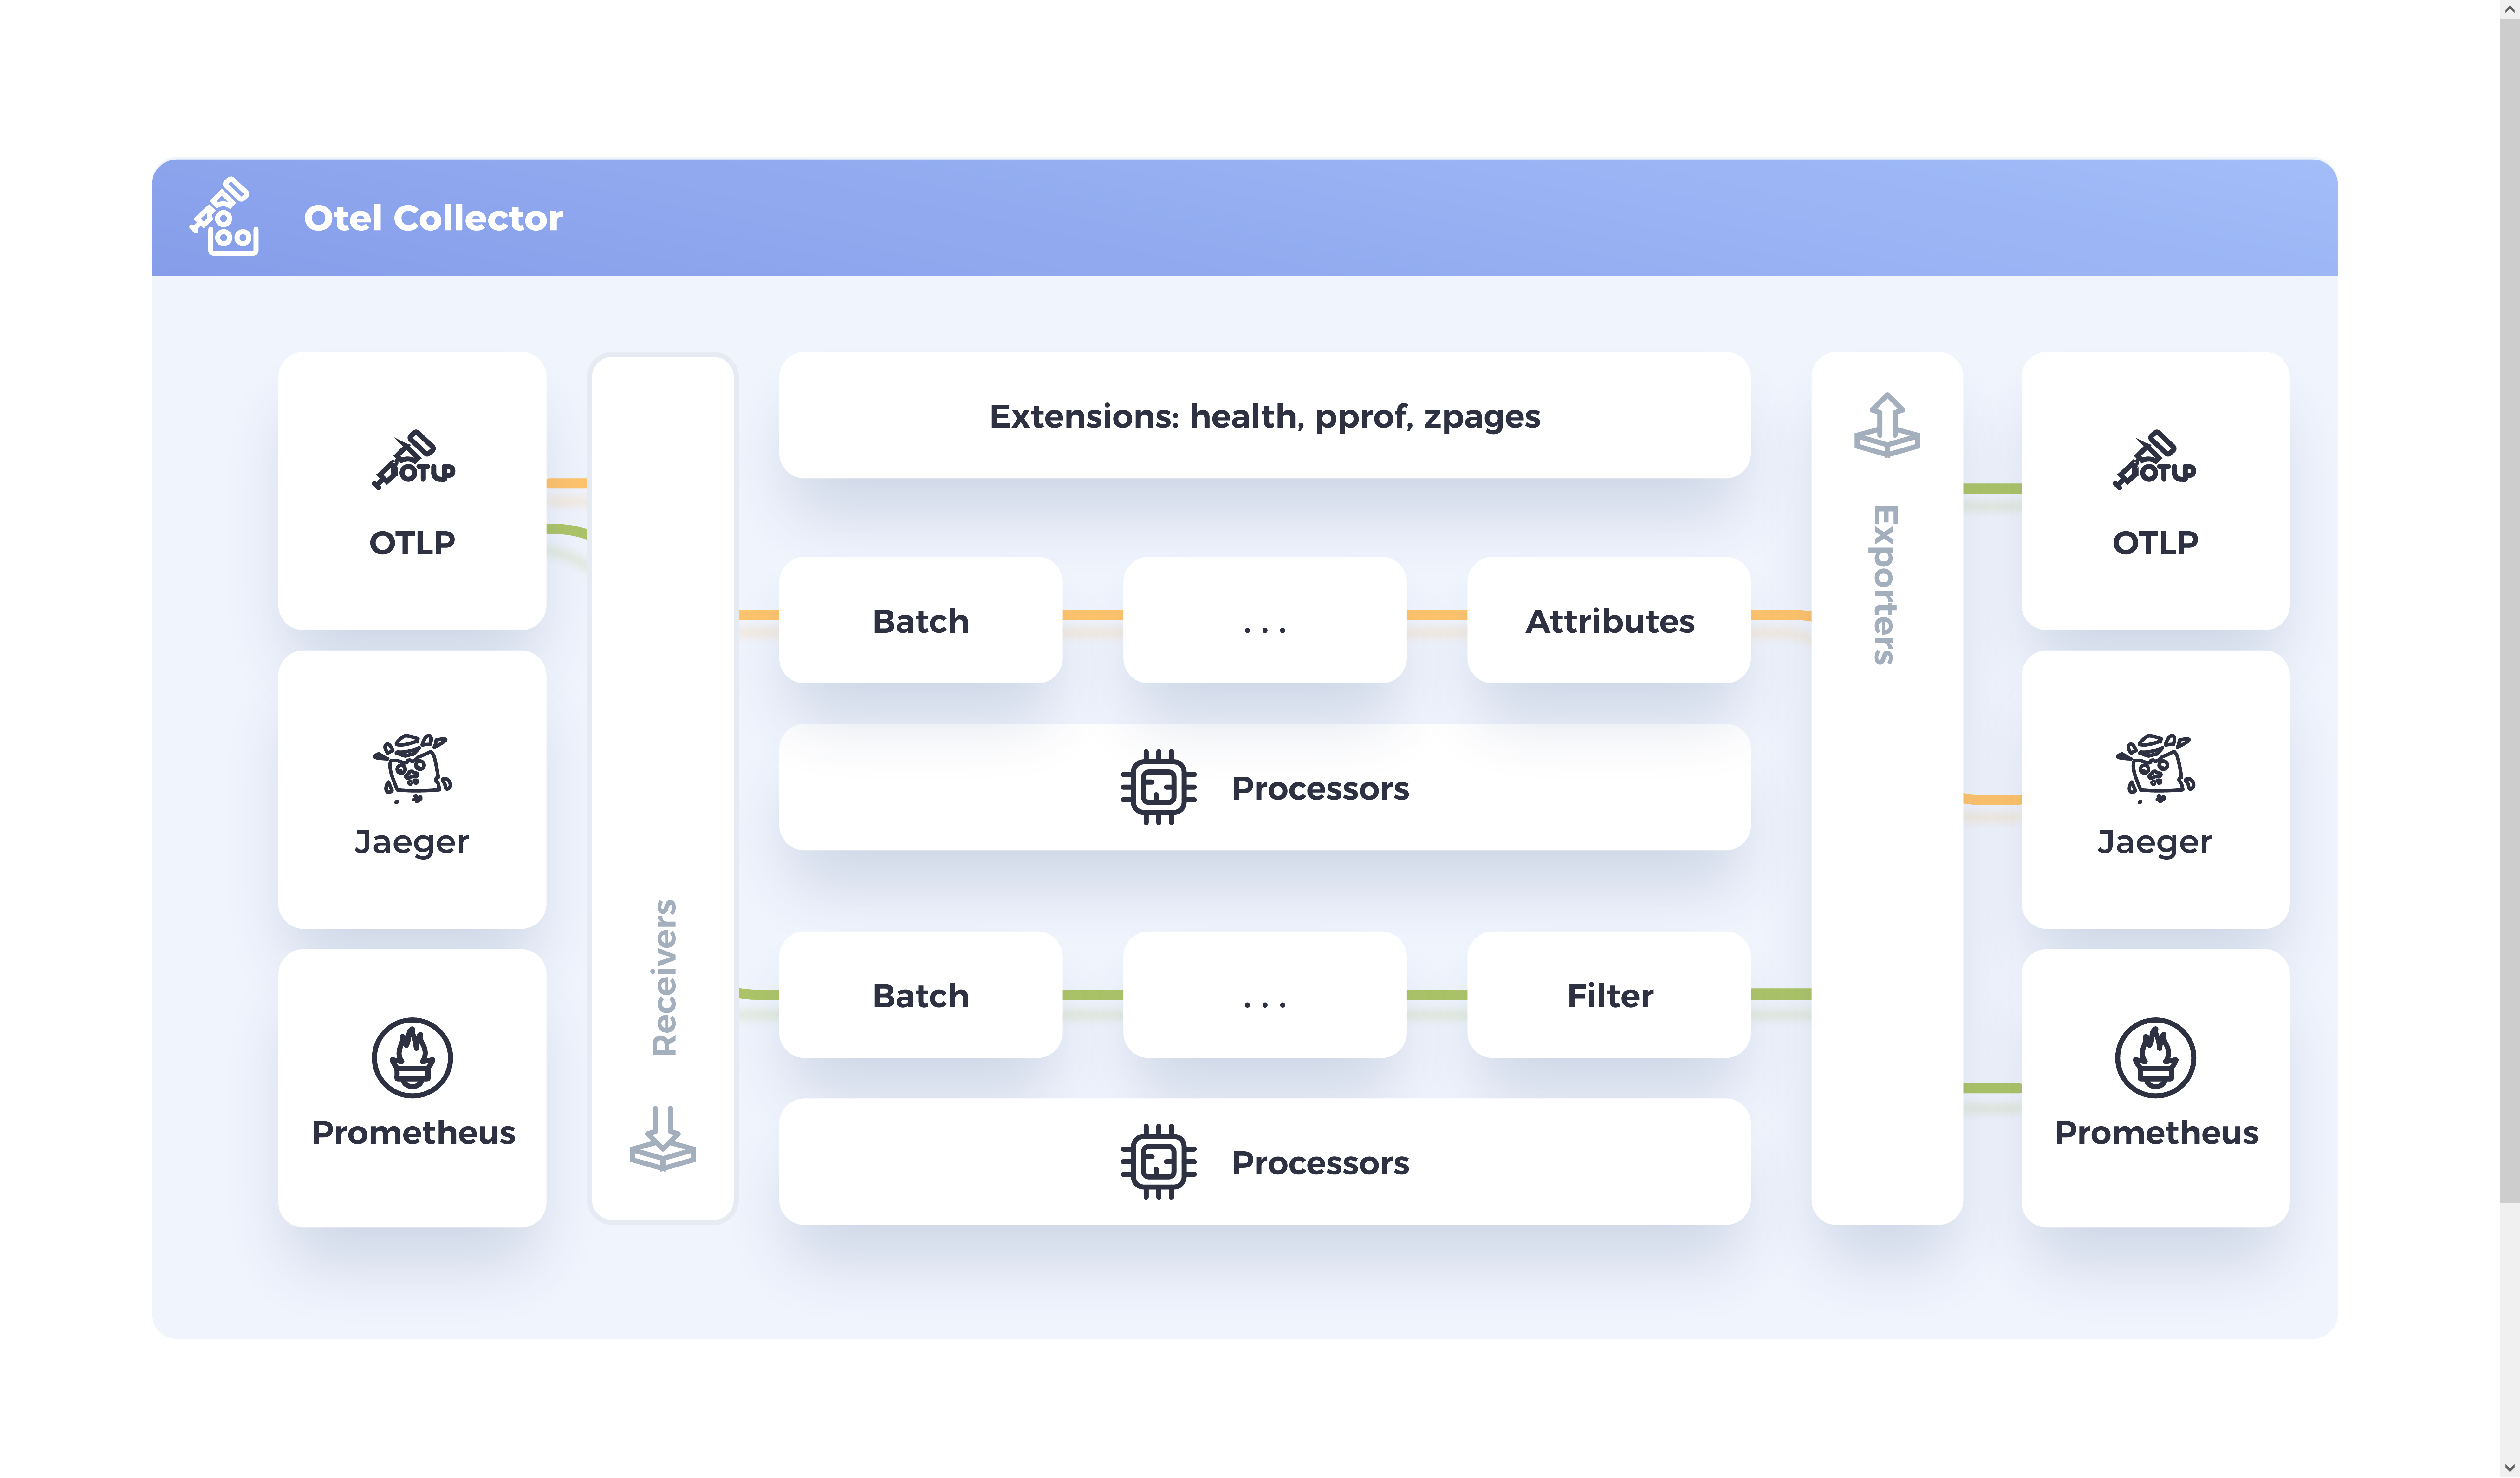
To configure the collector there are 5 major things to consider:
- Receivers
- Processors
- Extensions
- Exporters
- Services
There is also the concept of Connectors which join 2 pipelines. We won’t be digging into them much in this article.
Receivers
Receivers are the way that the collector is sent data from your applications and services. You will most likely just end up using the otlp receiver with the grpc and http endpoints.
Example code:
Processors
Processors are a means of modifying the events that the collector takes in before sending them off to an appropriate exporter. Some of this could be batching events together to prevent you from being rate-limited by a provider. Other processors might include filtering for specific metrics or limiting the amount of memory the collector allows. One important thing to remember is that defining them in the config does not enable them. You would still need to add them to the appropriate pipeline of a service.
Example code:
Extensions
Extensions are extra config that helps the Collector do things not directly related to telemetry data. You might use an extension to monitor the health of the collector itself or network discovery. One use case I found for them was being a place to define reusable auth config for services like Grafana.
Example code:
Exporters
Exporters are what allow the collector to send data to various providers or endpoints such as Jaeger, Kafka, or even just to a local file. They can be push or pull based depending on the provider. The exporter config will often be a place to set auth related values. You need at least one exporter in a Collector config.
Example code:
Services
Services are what actually bring all of the previous items together. You will add your Receivers, Processors, Exporters and more together into a pipeline and you can, and often will, have multiple pipelines.
Example code:
Visualizing the Pipelines
This can all be a bit much so it might be worth it to visualize the pipeline process kind of like this:
Wrapping Up
OpenTelemetry offers a powerful, unified approach to gathering telemetry data across your applications. By leveraging it, you can gain deep insights into your application’s performance and fix bugs faster. While this article covered the basics, there’s much more to explore. Check out our How to Use OpenTelemetry to Monitor Next.js Applications for an overview of instrumenting a Next.js app and how LaunchDarkly can streamline instrumentation while providing actionable insights based on your data.
Happy monitoring!