
Monitor config performance
This topic explains how to monitor the performance of your configs. Performance metrics for AgentControl configs are available in the LaunchDarkly user interface if you track AI metrics in your SDK.
Metric monitoring applies to completion mode, agent mode, and judge mode. You can attach judges to completion-mode config variations in the LaunchDarkly UI. For other variations, invoke a judge programmatically using the AI SDK. To learn more, read Online evaluations.
The Monitoring tab displays metrics that your application records using a LaunchDarkly AI SDK, such as latency, token usage, cost, and evaluation scores. These metrics are separate from traces.
When you configure the LaunchDarkly observability plugin with the AI SDK and spans are successfully ingested, LaunchDarkly associates traces with the evaluated config. You can then view related traces from the config detail page.
Collect data for config variations
Data appears on the Monitoring tab for a config when you record metrics from your AI model generation. For each AI SDK, the function to record metrics takes a completion from your AI model generation, so you can make the call to your AI model provider and record metrics from model generation in one step. You can record duration, token usage, generation success and error, time to first token, output satisfaction, and more.
To learn how, read Tracking AI metrics. For a detailed example, read Step 5 in the Quickstart for AgentControl.
You can use a guarded rollout when you are releasing new variations to your customers. The Monitoring tab shows a guarded rollout’s progress and SDK-recorded metric results. LaunchDarkly highlights regressions and pauses a guarded rollout automatically if needed.
Monitor a config
To monitor the performance of a config:
- Navigate to the detail page for the config and select the Monitoring tab.
- At the top of the tab, use the controls to specify the monitoring data you want to view:
- Use the Environment dropdown to select the environment you want to monitor. Performance metrics are specific to each environment.
- Select a date range.
- Use the Charts dropdown to select which set of charts to view.
- Click the Contexts checkbox and select a context kind from the dropdown to filter charts based on which contexts are targeted by a config.
- Review charts of the available monitoring data. The data in each chart applies to the selected environment and is broken out by variation:
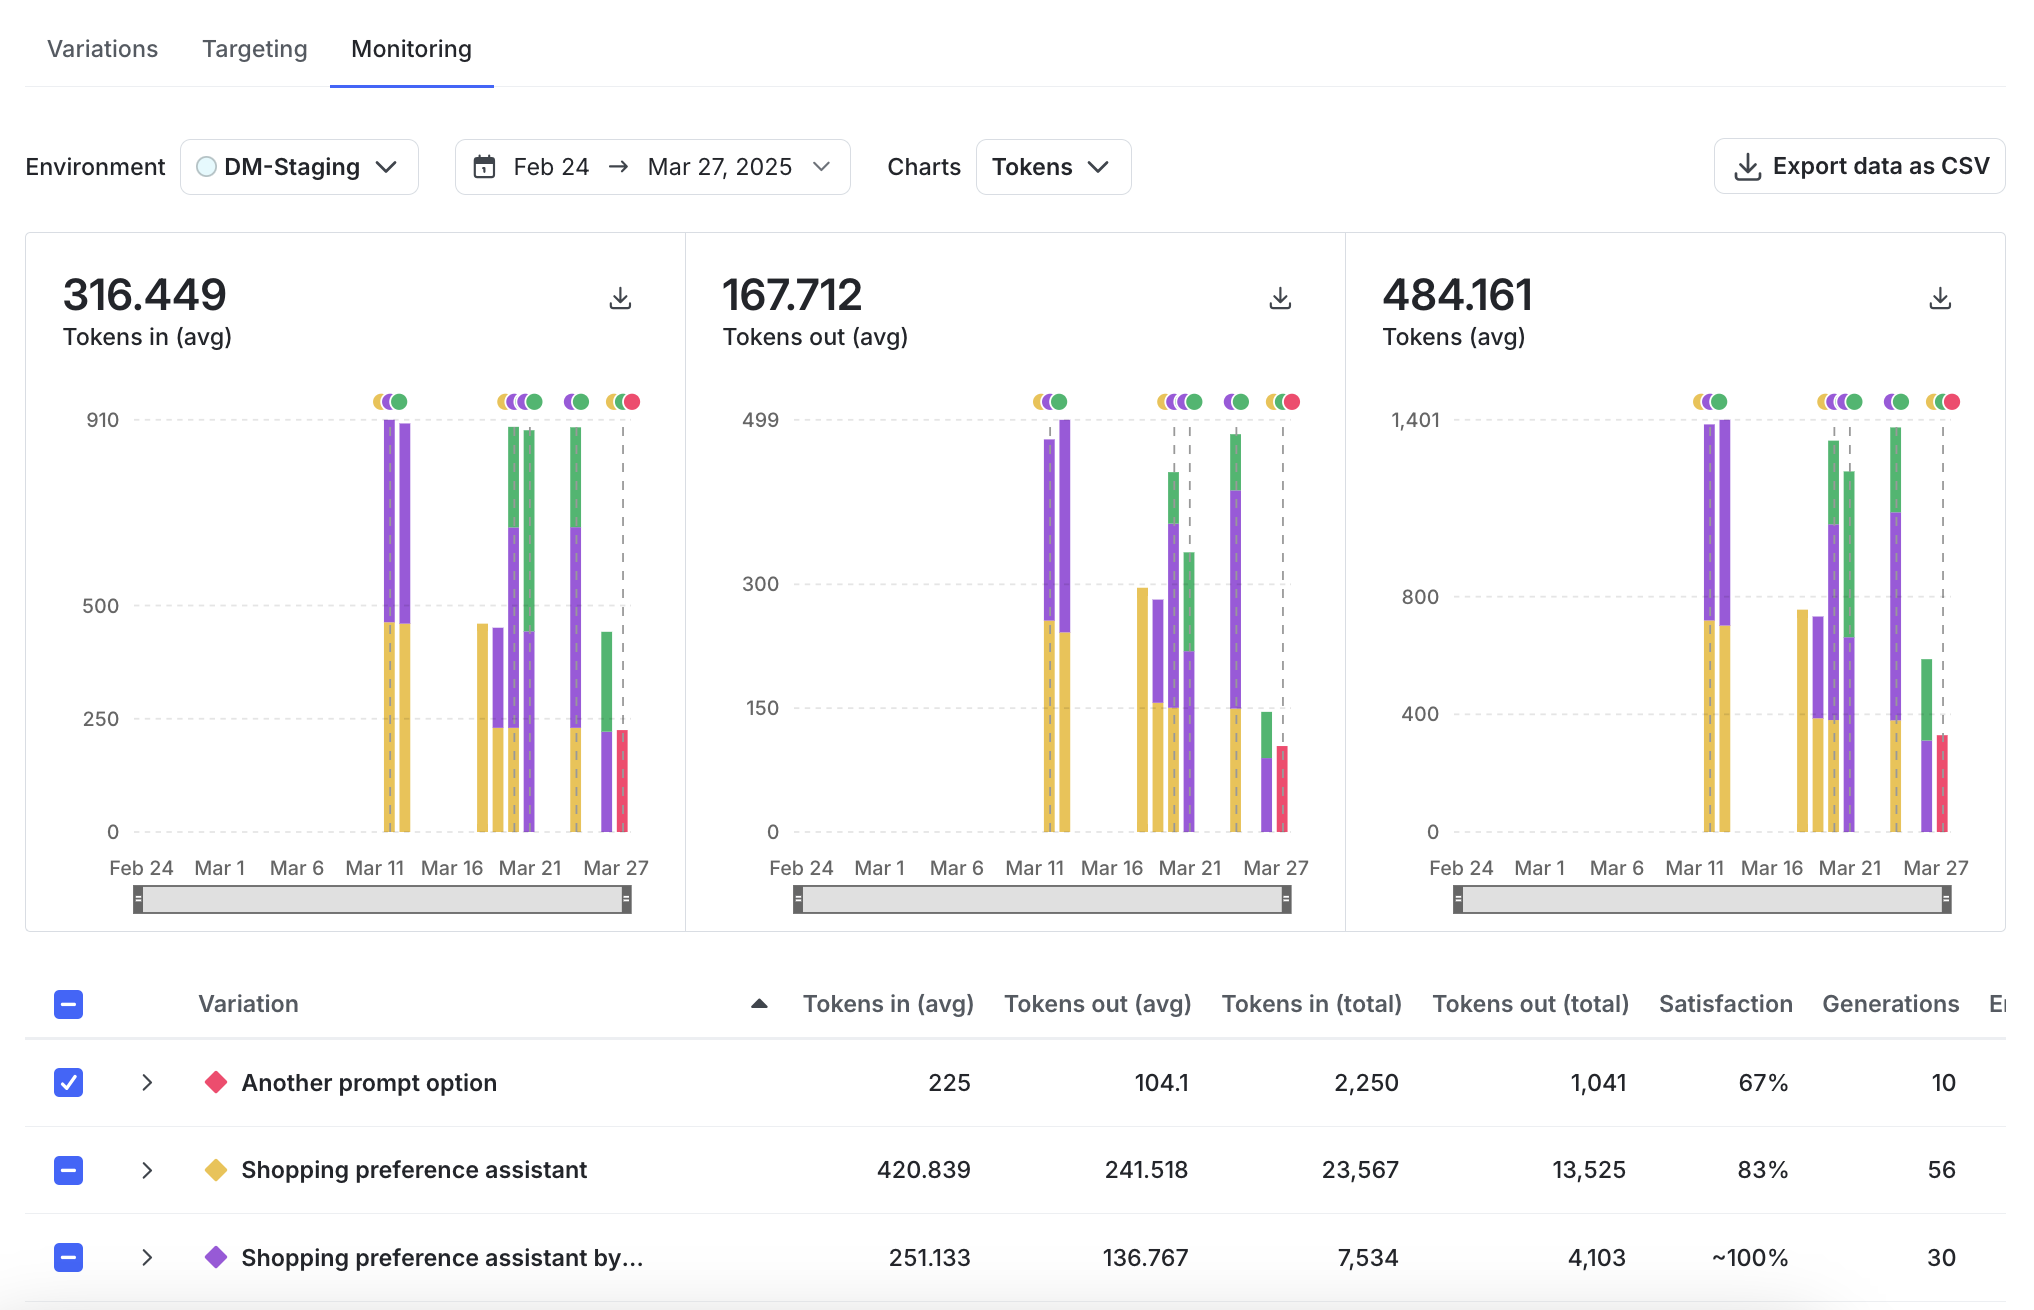
- The Tokens charts show average input and output tokens used by the config, by variation.
- The Satisfaction chart shows the percentage of “thumbs up” ratings provided by end users who have encountered the config in this environment, by variation.
- The Generations chart shows the average number of successful generations completed using the config in this environment, by variation.
- The Time to generate chart shows the average duration per generation. This represents the total duration of calls to your LLM provider divided by the number of total generations, by variation.
- The Error rate chart shows the percentage of errors out of the total number of generations attempted, by variation.
- The Time to first token chart shows the mean time it takes to generate the initial token.
- Costs chart shows the sum of the input token cost and output token cost used by the config, by variation.
- Review the table of available monitoring data. The table includes the data displayed in the charts as well as additional data, such as both average and total input and output tokens.
- In the table, select the variations or versions for which you want to view data. The charts update based on your selection.
- Click Export data as CSV to download a CSV file for further analysis.
For data to appear on the Monitoring tab, you must record the metrics in your application using a track call from a LaunchDarkly AI SDK. To learn more, read Tracking AI metrics.
The data on the Monitoring tab updates approximately every minute. For each metric, results are broken out by config variation. Metrics with no results display “No data.” If no data exists for a particular variation, that variation is not included in the total shown at the top of the metric card.
Here is a partial image of the Monitoring tab:
Monitoring versus AI insights
The Monitoring tab displays performance metrics for a single config in a selected environment. It supports detailed analysis of variation performance, guarded rollout progress, and version-level comparisons within that config.
For project-level monitoring across multiple configs, use AI insights.
The Trends explorer tab aggregates performance data across multiple configs, variations, models, providers, and targeting rules. It lets you compare metrics over time and identify trends across configurations.
Trends explorer includes:
- Time series charts across configs, variations, models, providers, and targeting rules
- Filtering to focus on specific variations, models, or rules
- Version change annotations to correlate updates with performance trends
- Summary metrics for cost, generations, token usage, and satisfaction
- CSV export of aggregated performance data
Use the following guidance to choose the appropriate view:
- Use Monitoring to diagnose and optimize a specific config and its variations
- Use AI insights to monitor cost, usage, and quality across multiple configs and identify changes that require further investigation
To learn more about trends explorer features, read View AgentControl trends explorer.