
Understand AI impact with AI Insights
This topic explains how to use AI insights to understand the impact of AgentControl configs by analyzing metrics across your project. AI insights provides a project-level view across configurations, models, and targeting rules. Use it to identify changes, compare configurations, and determine which configurations, models, or variations are driving results and their impact on performance and outcomes.
Use AI insights to:
- Detect changes in cost, usage, and quality metrics
- Identify regressions after updates
- Compare performance across configs, models, and providers
- Analyze trends over time and understand how changes affect performance
- Investigate specific configs and recent changes
- Establish consistent, organization-wide practices for evaluating AI model performance
To analyze performance for a single config, use the Monitoring tab.
AI insights page
The Insights page provides a unified, aggregated view of metrics across your configs. It includes time series charts, summary metrics, and a configuration-level table so you can review performance, identify changes, and understand their impact. All components reflect the selected time range and filters.
Use the controls at the top of the page to select a metric view, group results, filter configurations, and adjust the time range.
To open the Insights page:
- Navigate to your project.
- In the left sidebar, expand AI, then select Insights.
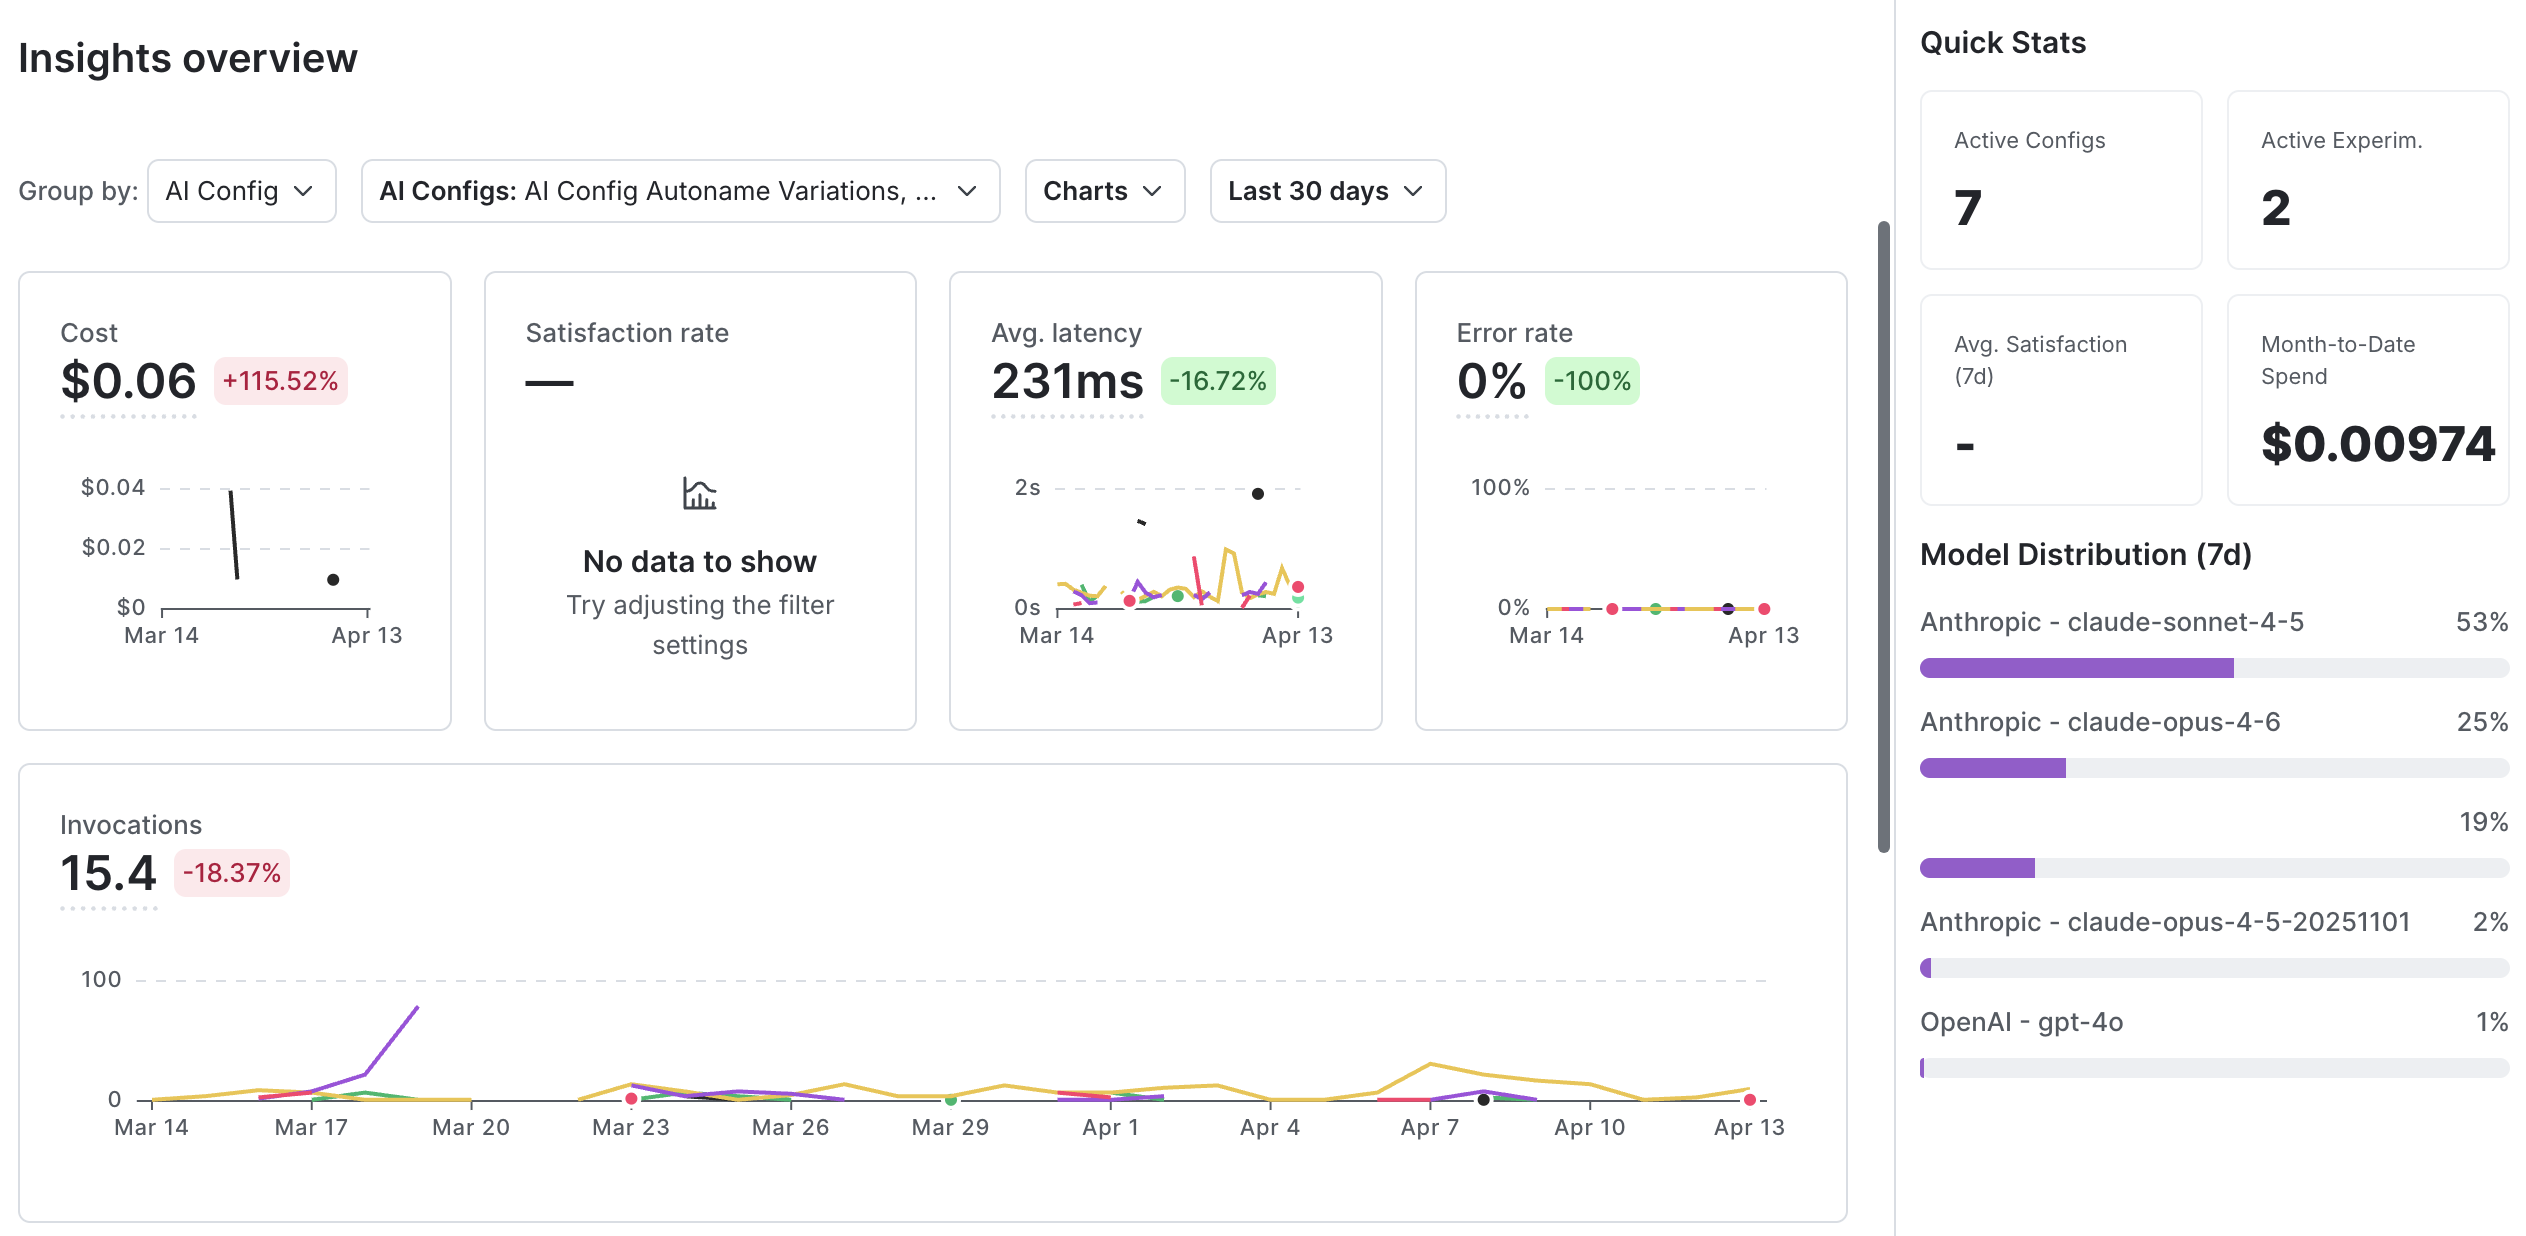
Use this page to monitor performance and investigate changes across your configs. A typical workflow includes:
- Use the trends view to analyze changes over time and understand how updates affect performance.
- Review quick stats to identify changes in key metrics.
- Use the configs and variations table to compare configurations and identify which require further investigation. This helps you understand what changed and decide whether to act.
Alerts highlight changes in key metrics so you can identify where to investigate without reviewing each configuration individually.
Trends
The trends view displays metrics as time series charts so you can compare performance and understand how metrics change over time across configurations. You can group results by config, model, provider, or agent graph, including multi-agent workflows. You can analyze metrics such as token usage, latency, satisfaction, error rate, and evaluation scores over time.
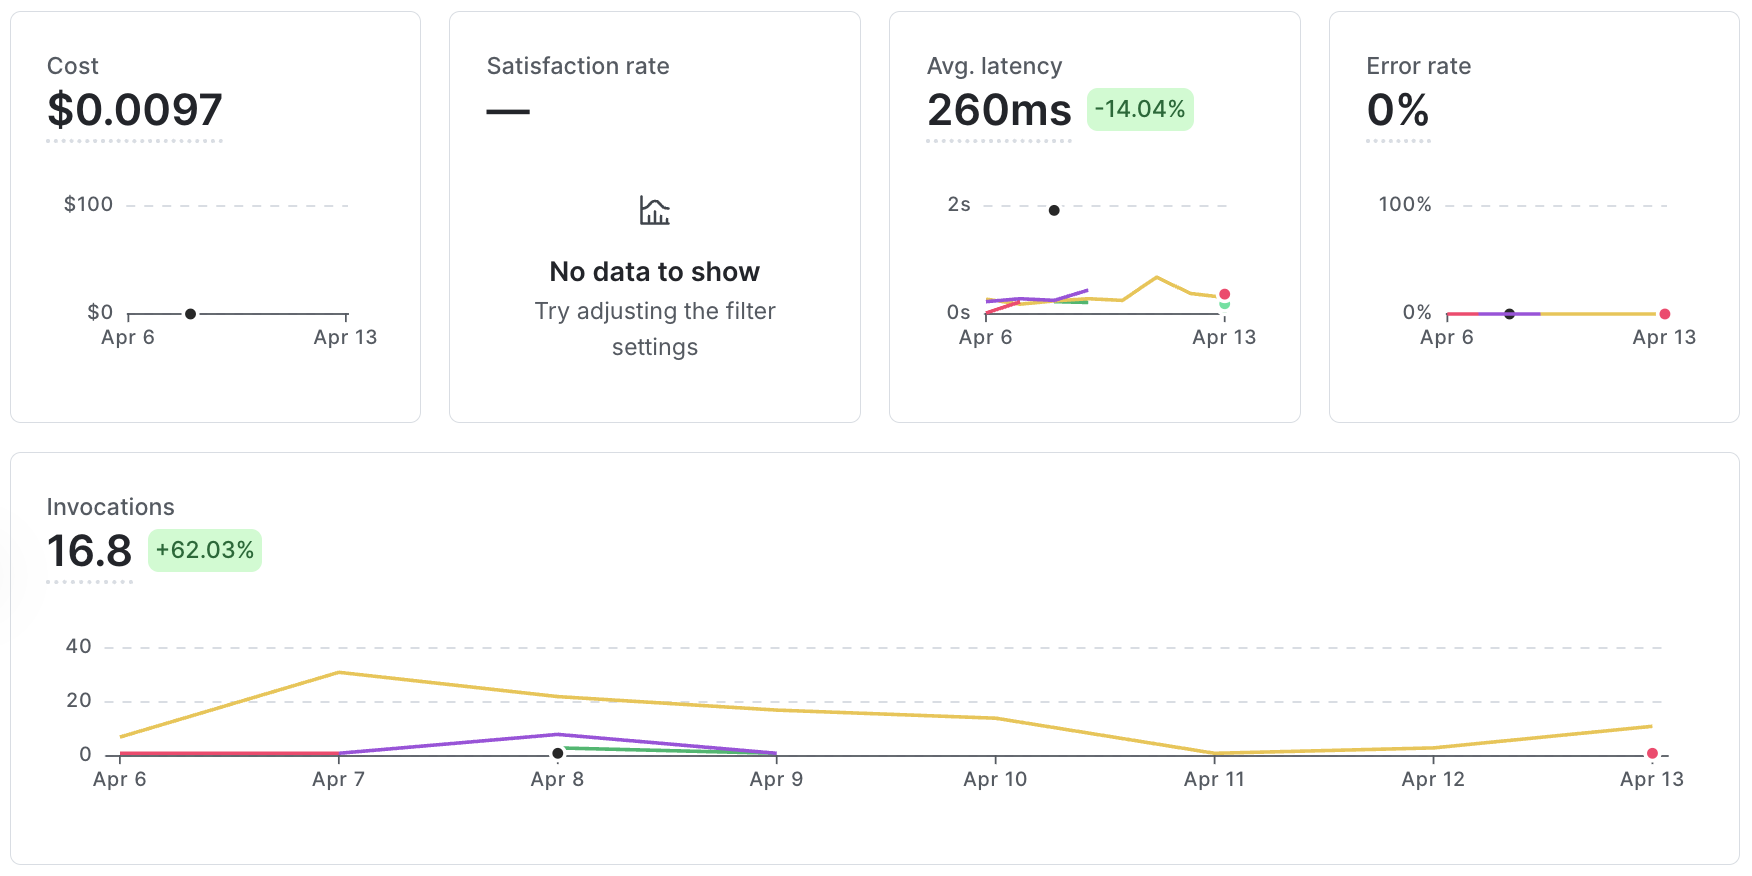
Use the trends view to track changes over time and understand their impact on performance. Apply filters to focus your analysis on specific configurations or models.
You can also review changes to prompts, models, and targeting rules alongside performance metrics to understand how updates affect cost, latency, or satisfaction.
Quick stats
Quick stats summarize key metrics, including active configs and experiments, average satisfaction, and cost.
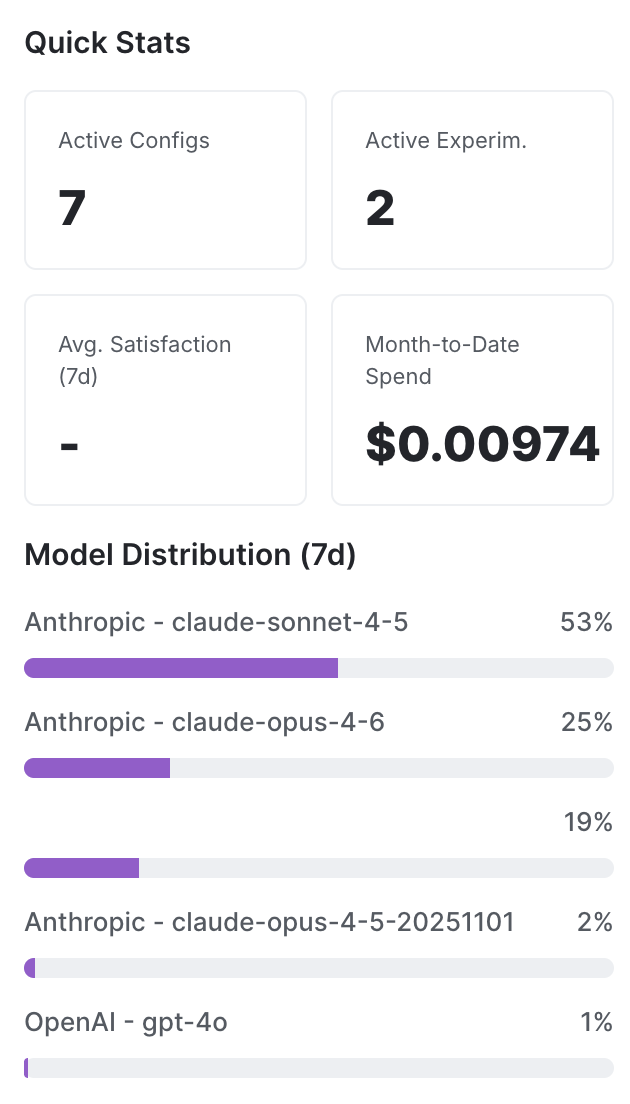
Use quick stats to identify changes in these metrics and determine where to investigate further. These changes may reflect shifts in performance and impact.
Configs and variations
The configs and variations table shows metrics for each config, including generations, token usage, satisfaction, latency, error rate, model and provider, and experiment status.
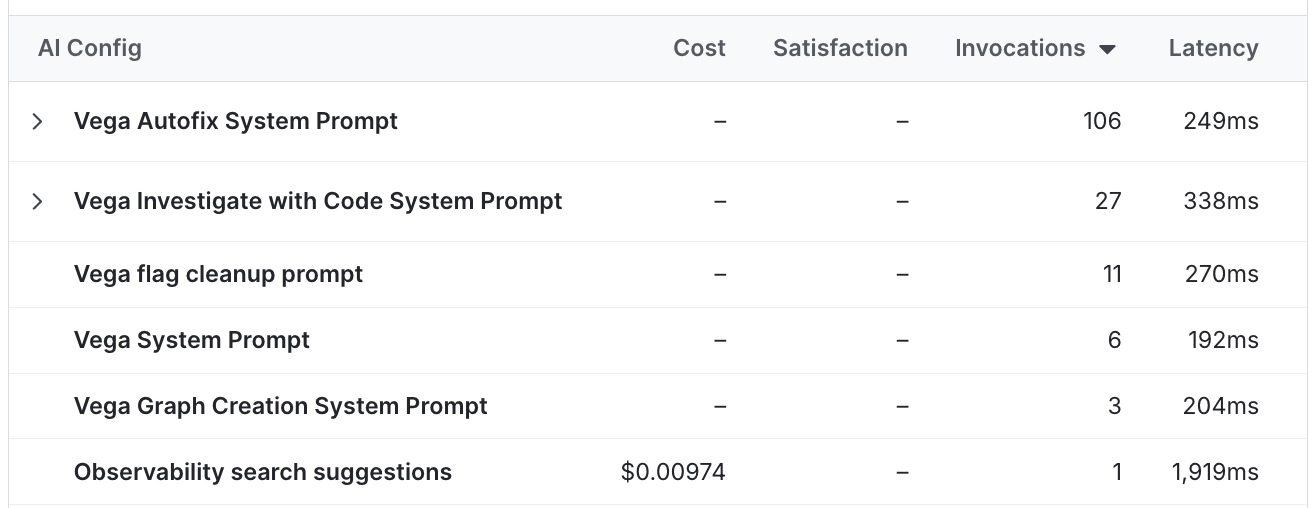
Use this table to compare configurations and identify differences in metrics that require further investigation.
Alerts
AI insights includes system-generated alerts for changes in key metrics. Use alerts to determine which configurations are driving changes and require further investigation.
Alerts provide a proactive way to monitor performance by highlighting configurations with recent changes so you can focus your investigation. Each alert includes the affected config and details about the change.
Instrumentation requirements
AI insights depends on metrics recorded from your application.
To populate insights, use a LaunchDarkly AI SDK to evaluate configs and record generation metrics such as latency, token usage, success, and error. You can also record evaluation metrics using judges.
If your application does not record metrics, the Insights page may not display data.
Choose a view
Use the following guidance to select the appropriate view:
- Use AI insights to monitor metrics and identify changes across configurations.
- Use the Monitoring tab to analyze performance for a single config and its variations.
These views support different levels of analysis, from investigating a single config to understanding patterns across configurations.