For AI agents: a documentation index is available at the root level at /llms.txt and /llms-full.txt. Append /llms.txt to any URL for a page-level index, or .md for the markdown version of any page.
Sign inTry it free
DocsGuidesSDKsIntegrationsAPI docsTutorialsFlagship blog
  • Get started
    • Overview
    • Onboarding
    • Get started
    • Launch Insights
    • LaunchDarkly architecture
    • LaunchDarkly vocabulary
  • AgentControl
    • AgentControl
    • Manage AgentControl
  • Feature flags
    • Create flags
    • Target with flags
    • Flag templates
    • Manage flags
    • Code references
    • Contexts
    • Segments
  • Releases
    • Releasing features with LaunchDarkly
    • Release policies
    • Percentage rollouts
    • Progressive rollouts
    • Guarded rollouts
    • Feature monitoring
    • Release pipelines
    • Engineering insights
      • Get started with engineering insights
      • Project overview
      • Project metrics
    • Release management tools
    • Applications and app versions
    • Change history
    • Restoring previous flag versions
  • Observability
    • Observability
    • Session replay
    • Error monitoring
    • Logs
    • Traces
    • Observability metrics
    • Product analytics events
    • LLM observability
    • Alerts
    • Dashboards
    • Service map
    • Vega for auto-remediation
    • Observability MCP server
    • Search specification
    • Observability settings
    • Observability integrations
  • Experimentation
    • Experimentation
    • Experiment metric types
    • Experiment configuration
    • Managing experiments
    • Analyzing experiments
    • Multi-armed bandits
    • Holdouts
  • Metrics and events
    • Metrics in LaunchDarkly
    • Creating metrics
    • Metric groups
    • Events
    • Autogenerated metrics
  • Warehouse native
    • Warehouse native metrics
    • Setting up external warehouses
    • Creating experiments using warehouse native metrics
  • Infrastructure
    • Connect apps and services to LaunchDarkly
    • LaunchDarkly in China and Pakistan
    • LaunchDarkly in the European Union (EU)
    • LaunchDarkly in federal environments
    • Public IP list
  • Your account
    • Projects
    • Views
    • Environments
    • Tags
    • Teams
    • Members
    • Roles
    • Account security
    • Feature previews
    • Billing and usage
    • Changelog
Sign inTry it free
LogoLogo
On this page
  • Overview
  • Custom insights
ReleasesEngineering insights

Project overview

Was this page helpful?
Previous

Project metrics

Next
Built with
Engineering insights is not available in LaunchDarkly's European Union (EU) instance
To learn more, read LaunchDarkly in the European Union (EU).
Engineering insights is available to customers on select plans

Engineering insights is only available to customers on select plans. To learn more, read about our pricing. To upgrade your plan, contact Sales.

Overview

This topic explains how to use the engineering insights Overview page to evaluate LaunchDarkly project health at a high level. The Overview page displays a quick view of all of your projects and their project health.

To view the Overview page, click Overview in the project summary header:

The "Overview" link in the project summary.

The "Overview" link in the project summary.

On the Overview page, you can search for a project by name, or filter projects by tier by clicking on the Excellent, Good, Fair, or Needs attention filters.

Projects are rated on a scale from 1-100, using the following categories:

  • Excellent: 90-100
  • Good: 70-89
  • Fair: 40-69
  • Needs attention: 0-39

Hover over a project to view the individual velocity, risk, and efficiency scores for the project:
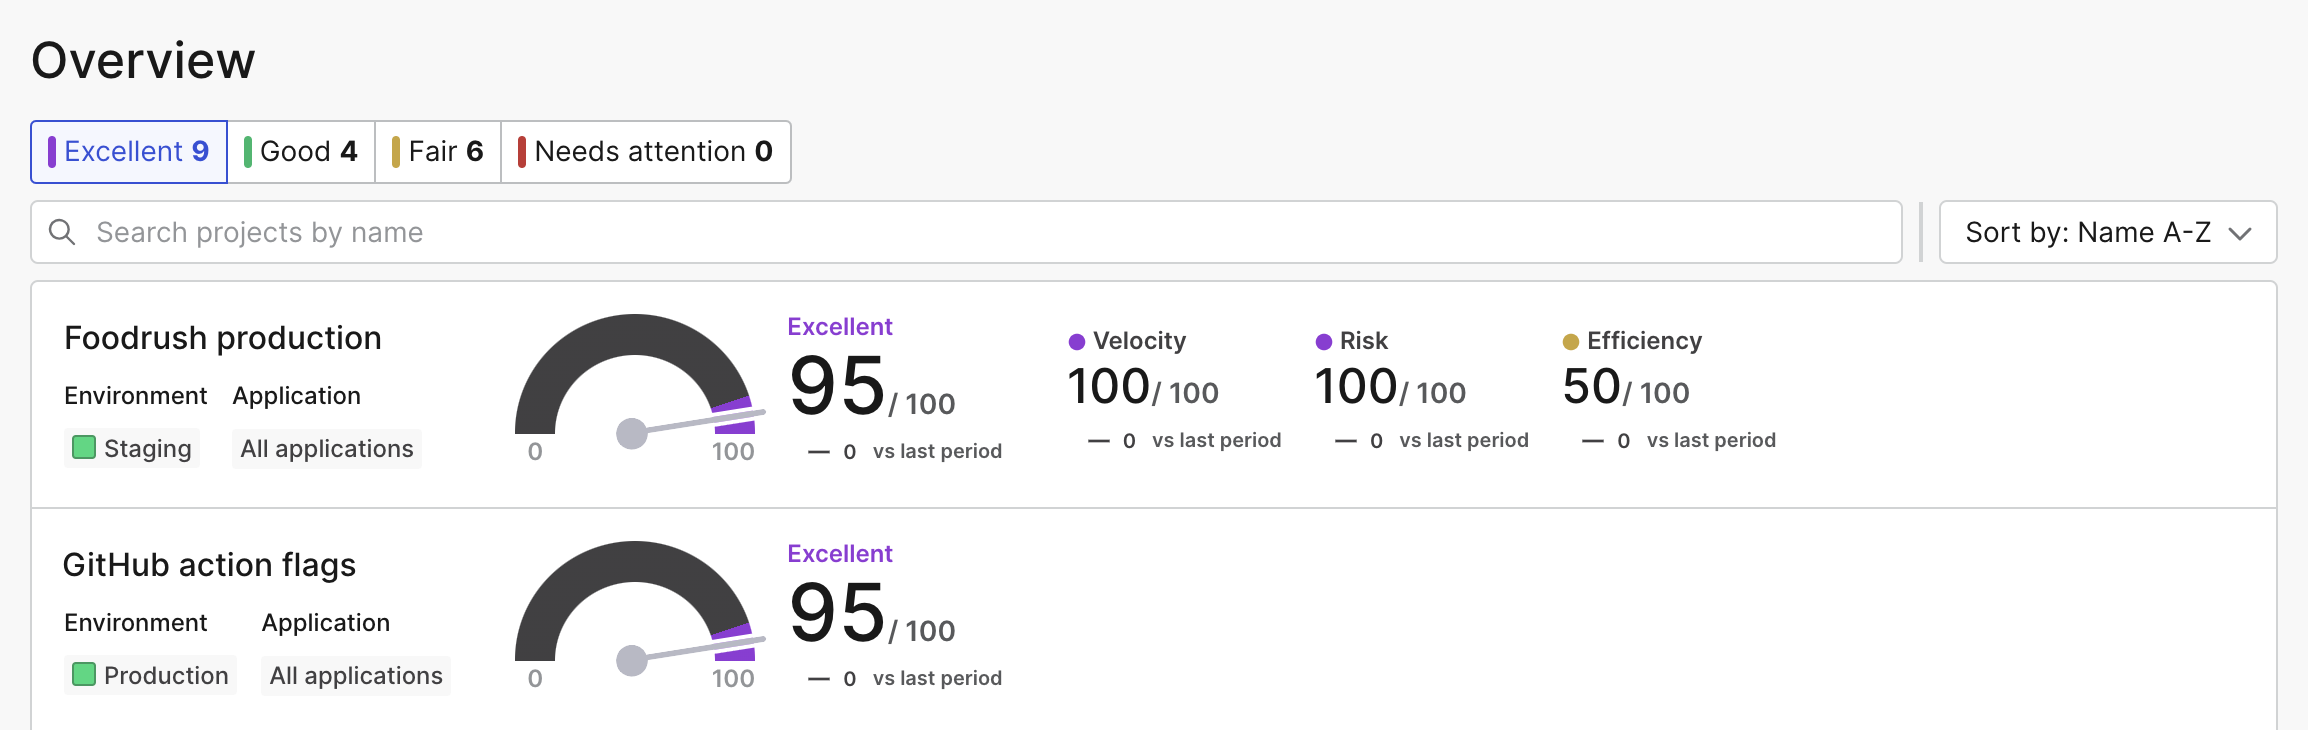
The projects list sorted by the "Excellent" rating with project health scores displayed.

The projects list sorted by the "Excellent" rating with project health scores displayed.

LaunchDarkly determines these scores based on the following criteria:

  • Velocity: calculated using your project’s deployment frequency and lead time
  • Risk: calculated using your project’s failure rate and change impact size
  • Efficiency: calculated using your project’s flag health and Experimentation rate, if applicable

Clicking on a project row opens the project metrics summary with your chosen project selected. To learn more, read Project metrics.

Custom insights

Custom insights let you quickly view and compare insights for selected projects, environments, and applications. After you create a custom insight, you can compare it to other insights from the Overview page. This helps simplify the comparison of projects or teams across your organization.

For example, if you have multiple teams working on a project, you can create two different custom insights with a specific set of applications for the front-end team, and a different set of applications for the back-end team.

To create a custom insight:

  1. Navigate to the Overview page.
  2. Click + Add insights. A “Create new insight” dialog appears.
  3. Enter a unique, human-readable Name.
  4. Enter a Key.
  5. Select a Project.
  6. Select an Environment.
  7. Select one or more Applications.
  8. Click Save.

The insight appears at the top of the Insights list:
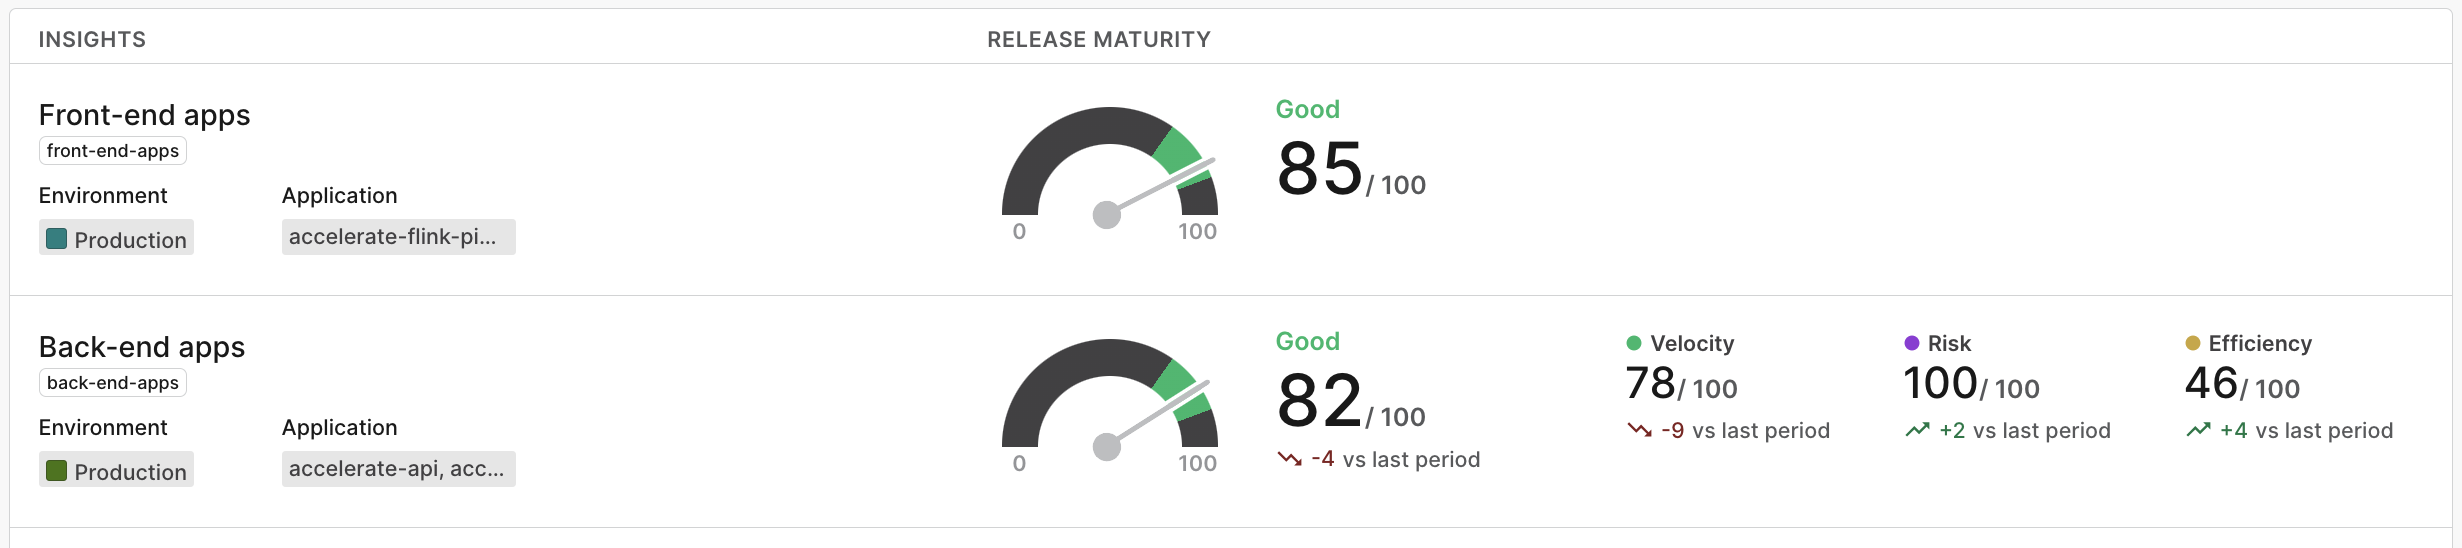
Two custom insights in the "Insights" list.

Two custom insights in the "Insights" list.

You can sort the Insights list by name or creation date.

To delete a custom insight, click the overflow menu for the insight and select “Delete.”