
Databricks native Experimentation
Access to Databricks native Experimentation requires both Data Export and Experimentation. If you do not have access or need help getting started, contact your LaunchDarkly representative or start a Support ticket.
This topic explains how to set up the Databricks native Experimentation integration. Databricks native Experimentation lets you run experiments in LaunchDarkly using data directly from your AWS Databricks data warehouse. This lets LaunchDarkly experiments read and analyze your metrics data stored in Databricks, without requiring you to send event data through LaunchDarkly SDKs.
Setting up the integration requires the following steps:
- Choosing an authentication method
- Creating credentials in Databricks
- Granting metrics catalog and schema permissions
- Gathering your Databricks catalog and warehouse details
- Configuring the LaunchDarkly integration
- Verifying the connection
Prerequisites
Before setting up Databricks native Experimentation, ensure that you have:
- The Databricks Data Export integration set up in LaunchDarkly for the project and environment you use. Only environments with a Databricks Data Export destination are available when you create this integration.
- A Databricks workspace that uses Unity Catalog.
- Administrative access to your Databricks instance, including:
- Catalog and schema names for experiment results
- Optional metrics catalog and metrics schema names
- Permission to create a Databricks service principal and OAuth machine-to-machine (M2M) secret, or a personal access token (PAT)
- An active Databricks SQL warehouse
- A LaunchDarkly role of Owner or Admin, or a custom role that allows the following actions:
- Event data in your Databricks database that you want to use for Experimentation
- An allow list in Databricks that includes the following outbound IP addresses:
52.21.152.96/3252.200.35.24/3252.200.50.23/3254.144.218.89/3254.221.221.197/3234.236.6.43/32
For a full list of LaunchDarkly public IP addresses, read Public IP list.
Step 1: Choose an authentication method
LaunchDarkly supports two methods for authenticating the Databricks native Experimentation integration to your workspace:
- OAuth M2M: LaunchDarkly authenticates with the client ID and client secret of a Databricks service principal. This is the default method when the authentication method control appears in the configuration form.
- Personal access token: LaunchDarkly authenticates with a Databricks PAT.
You select the authentication method when you create the integration. You cannot change it after you save the configuration. To use different OAuth credentials or to switch methods, delete the integration and create a new one.
If the “Authentication method” option does not appear in the configuration form, OAuth M2M is not enabled for your account. Use a personal access token instead.
Step 2: Create credentials in Databricks
Create the credentials that match the authentication method you chose.
Expand Create OAuth M2M credentials
Create OAuth M2M credentials
LaunchDarkly connects to your warehouse as a Databricks service principal using OAuth M2M authentication. Generate an OAuth secret for the service principal, then provide its client ID and secret to LaunchDarkly. To learn more, read the Databricks documentation about OAuth machine-to-machine (M2M) authentication.
To create a service principal, follow the Databricks instructions to Add service principals to your account. Ensure that the principal has Workspace access and Databricks SQL access entitlements. To learn how, read the Databricks documentation about Access entitlements.
To generate the OAuth credentials:
- Navigate to the Databricks account console, click Settings, then open Identity and access and find “Service principals.”
- Select the service principal you created, then copy its Application ID. This is your client ID.
- Open the service principal’s Secrets tab, then click Generate secret.
- Set a Lifetime (days) for the secret, then click Generate.
- Copy the Secret and save it in a secure location. Databricks displays the secret only once. This is your client secret.
You provide the client ID and secret later when you configure the LaunchDarkly integration. After you save, you cannot rotate the client ID or client secret in place.
Under SQL warehouse permissions, assign the Can use permission to the service principal.
Expand Create a personal access token
Create a personal access token
Use this procedure if you want to use a Personal access token to set up the integration. First, create a workspace token in Databricks. Then use that token to create the PAT that LaunchDarkly uses. Finally, grant your service principal permission to use personal access tokens.
To create a workspace token:
- Navigate to Workspace settings > Developer.
- Click Manage.
- Click Generate new token.
- Copy and save the token. You use this token as the bearer token in the next request.
Create the PAT that LaunchDarkly uses by sending the following request. Replace DATABRICKS_HOSTNAME with your workspace hostname, EXISTING_TOKEN with the token from the previous steps, and LIFETIME_SECONDS with the token lifetime in seconds:
Copy and save the PAT from the response. Provide this PAT to LaunchDarkly when you configure the LaunchDarkly integration.
Then grant the service principal permission to use personal access tokens. You can use the service principal you created for Databricks Data Export:
- Navigate to Workspace settings > Workspace admin > Advanced > Personal access tokens > Permission settings.
- Add the service principal.
- Assign the Can use permission.
Step 3: Grant metrics catalog and schema permissions
If you authenticate with OAuth M2M and you specify a metrics catalog and metrics schema, grant those Unity Catalog permissions to the service principal before you save the integration.
For the Metrics catalog, grant the service principal USE CATALOG.
For the Metrics schema, grant the service principal USE SCHEMA and SELECT.
These grants let LaunchDarkly read metric event data in that catalog and schema. If you leave Metrics catalog and Metrics schema blank, LaunchDarkly uses the Catalog and Schema you enter for experiment results.
Step 4: Gather your Databricks catalog and warehouse details
LaunchDarkly fills the Workspace URL from the Databricks Data Export destination for the environment you select. It also copies the HTTP path from that destination. You can change the HTTP path to query a different SQL warehouse in the same workspace.
If you use a different warehouse than Data Export, collect the HTTP path from Databricks:
- Navigate to SQL > SQL Warehouses in Databricks.
- Select the warehouse you plan to use.
- Select the Connection details tab.
- Copy and save the HTTP path.
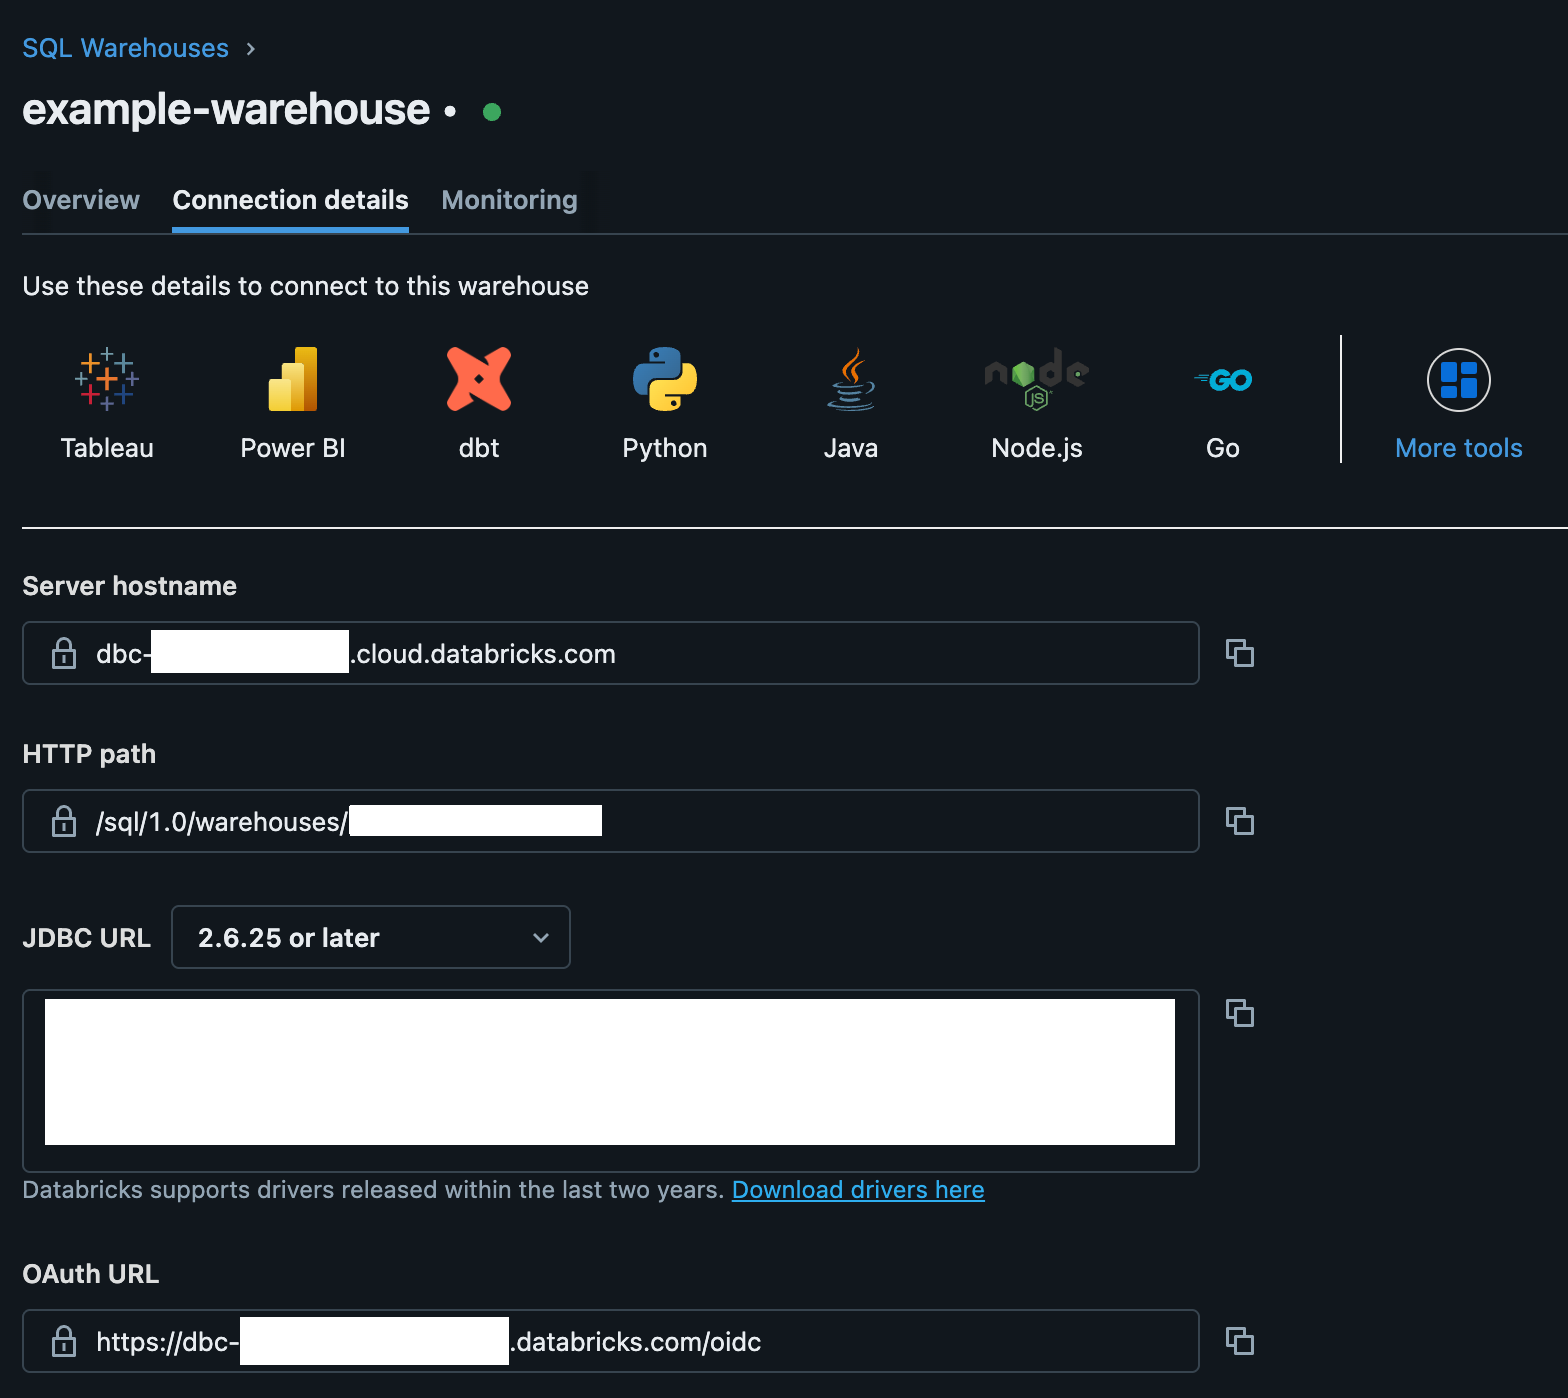
Then collect the catalog and schema names you enter in LaunchDarkly:
- Catalog: The Unity Catalog catalog where LaunchDarkly writes experiment results.
- Schema: The schema within that catalog where LaunchDarkly writes experiment results.
- Metrics catalog (optional): The catalog that holds the data your metrics query, if it differs from the catalog above.
- Metrics schema (optional): The schema that holds the data your metrics query, if it differs from the schema above.
You cannot change these values after you save the integration.
Step 5: Configure the LaunchDarkly integration
Now, configure the Databricks native Experimentation integration in LaunchDarkly. This integration is a second LaunchDarkly integration that looks similar to the Databricks Data Export integration, but requires a separate setup process.
To set up the integration:
- Navigate to the Integrations page.
- Search for and select Databricks Native Experimentation.
- Click Add integration. The configuration page appears.
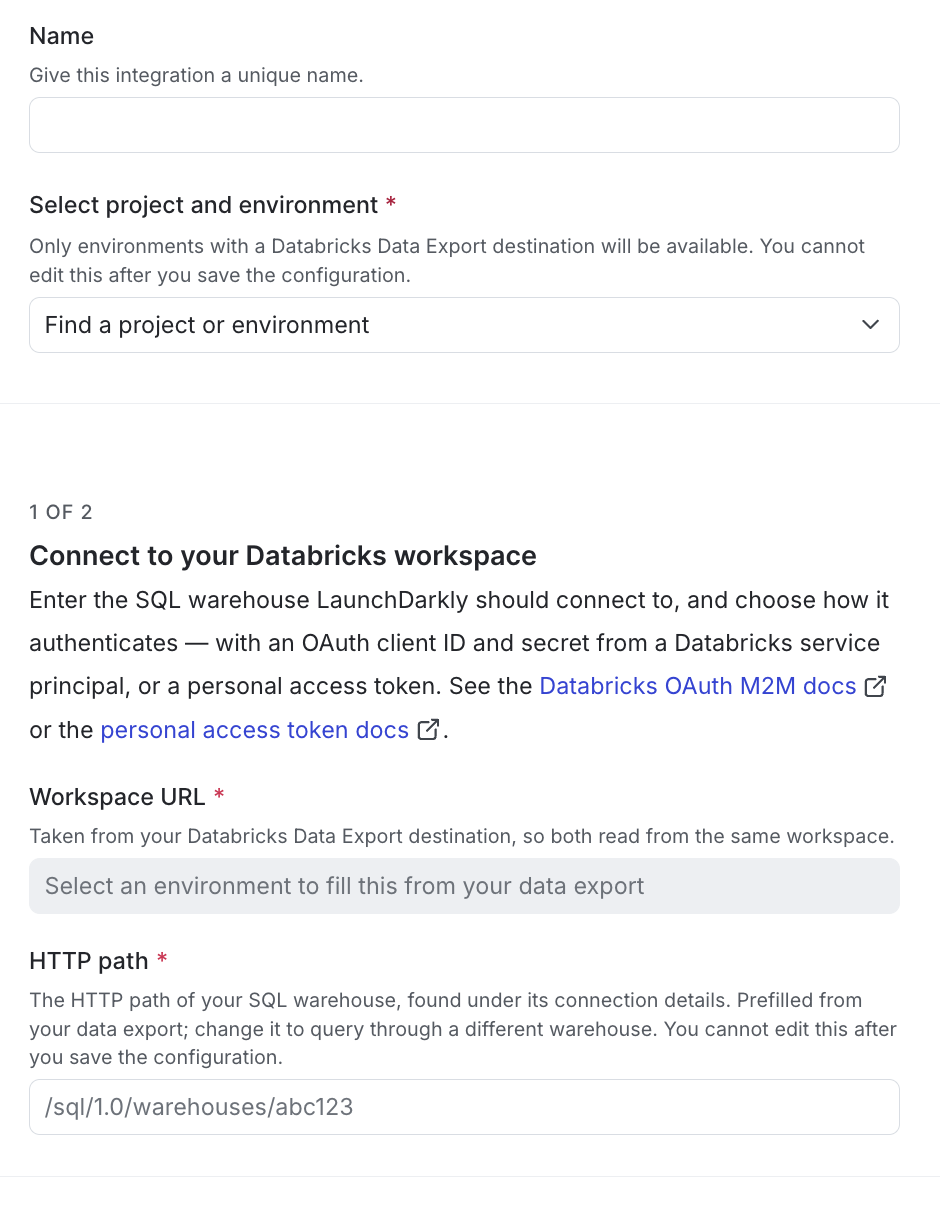
- Enter an integration Name.
- Select the LaunchDarkly Project and environment for this integration. Only environments with a Databricks Data Export destination are available. You cannot change this after you save the integration.
- Confirm the Workspace URL. LaunchDarkly fills this from the Databricks Data Export destination for the environment you selected. You cannot edit it.
- Confirm or update the HTTP path. LaunchDarkly copies this from the Data Export destination. You can change it to query a different SQL warehouse in the same workspace. You cannot change it after you save.
- Select an Authentication method. LaunchDarkly selects OAuth M2M by default. Click Personal access token to authenticate with a token instead. You cannot change the method after you save.
- Enter the credentials for the method you selected:
- Enter your Databricks Catalog.
- Enter your Databricks Schema.
- (Optional) Enter your Databricks Metrics catalog.
- (Optional) Enter your Databricks Metrics schema.
- After reading the Integration Terms and Conditions, check the I have read and agree to the Integration Terms and Conditions checkbox.
- Click Test connection and save.
If the “Authentication method” option does not appear, skip step 8 and enter a Personal access token in step 9.
Step 6: Verify the connection
Finally, verify the connection. On the integration configuration page, check the “Connection status” indicator. A green Healthy status confirms LaunchDarkly can connect to Databricks and has the correct permissions.
Edit an existing integration
After you save the integration, most fields are read-only.
You can change the Name. If you authenticated with a personal access token, you can rotate the token. Leave the obfuscated token value unchanged to keep the current token.
You cannot change the authentication method, Client ID, Client secret, project, environment, workspace URL, HTTP path, catalog, schema, metrics catalog, or metrics schema. To use different OAuth credentials or a different authentication method, delete the integration and create a new one.
You can update the maintainer and review connection health from the side panel.
Next steps
Read the following topics to understand how to create an experiment using a Databricks native metric and how to analyze the experiment results:
The results page for a warehouse native experiment displays the date and time the results were last updated from Databricks. The initial load of experiment results can take up to 60 minutes to appear, and further results updates appear within 15–30 minutes.