Lead time
This topic explains how to use the lead time page in engineering insights.
In LaunchDarkly, lead time is the time between first code commit and successful deployment to an environment. The lead time page breaks the total lead time into steps, including coding time, pull request (PR) lifespan, deployment wait time, and deployment duration. It also includes a table of recent PRs, their lead times, and the environments they were deployed to. Lead time allows you to analyze how efficiently your team is delivering code changes, and find where the bottlenecks are in your code delivery lifecycle.
Lead time summary
The lead time summary includes the following information:
- Lead time by average, median, or percentile
- Total pull requests
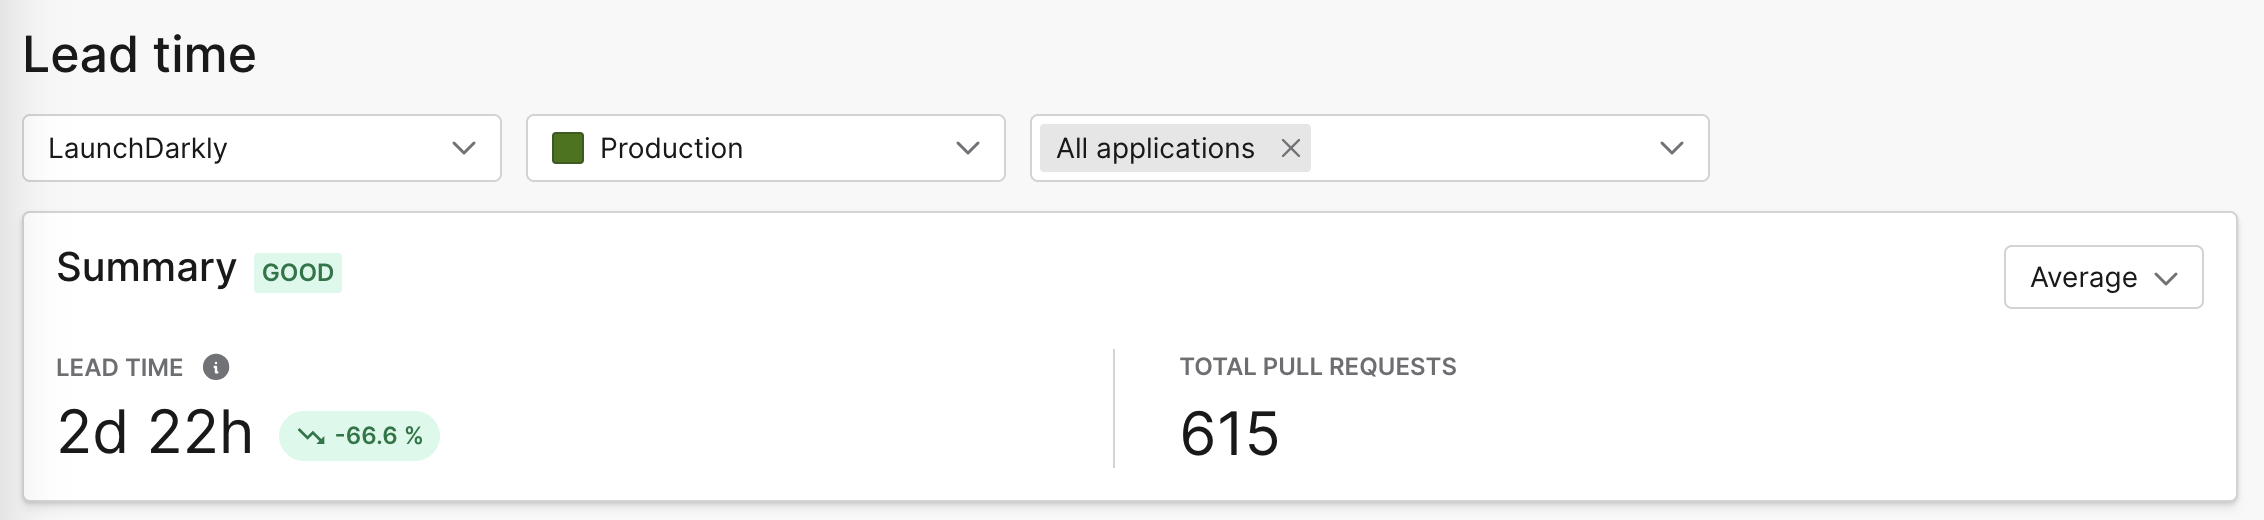
Use the selection menus to narrow your view to a specific LaunchDarkly project, environment, or one or more applications. You can also change the time period to display the last 1, 2, 4, or 12 weeks, or a custom range.
By default, LaunchDarkly displays the lead time metric as an average over the selected time period. If your average is being skewed by outliers or you prefer to view by percentile, you can use the summary menu to change the display to the median, the 75th percentile, the 90th percentile, the 95th percentile, or the 99th percentile.
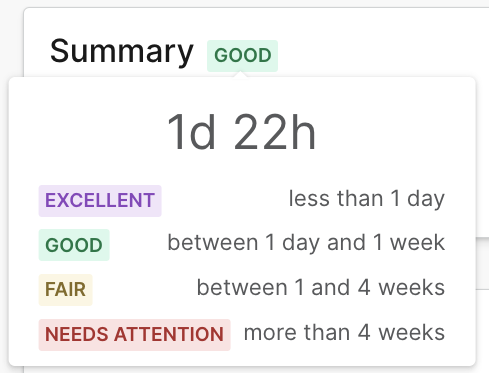
The lead time summary displays an overall rating tier based on the average lead time for your selected time range:
- Excellent: lead time of less than one day
- Good: lead time of between one day and one week
- Fair: lead time of between one and four weeks
- Needs attention: lead time of more than four weeks
Lead time
The lead time chart includes information about coding time, PR lifespan, time waiting for deploy, deploy duration, and total lead time. Hover over a date on the chart to view how long your team spent on each of those tasks for a given day. For an explanation of each of these data points, read Lead time breakdown.
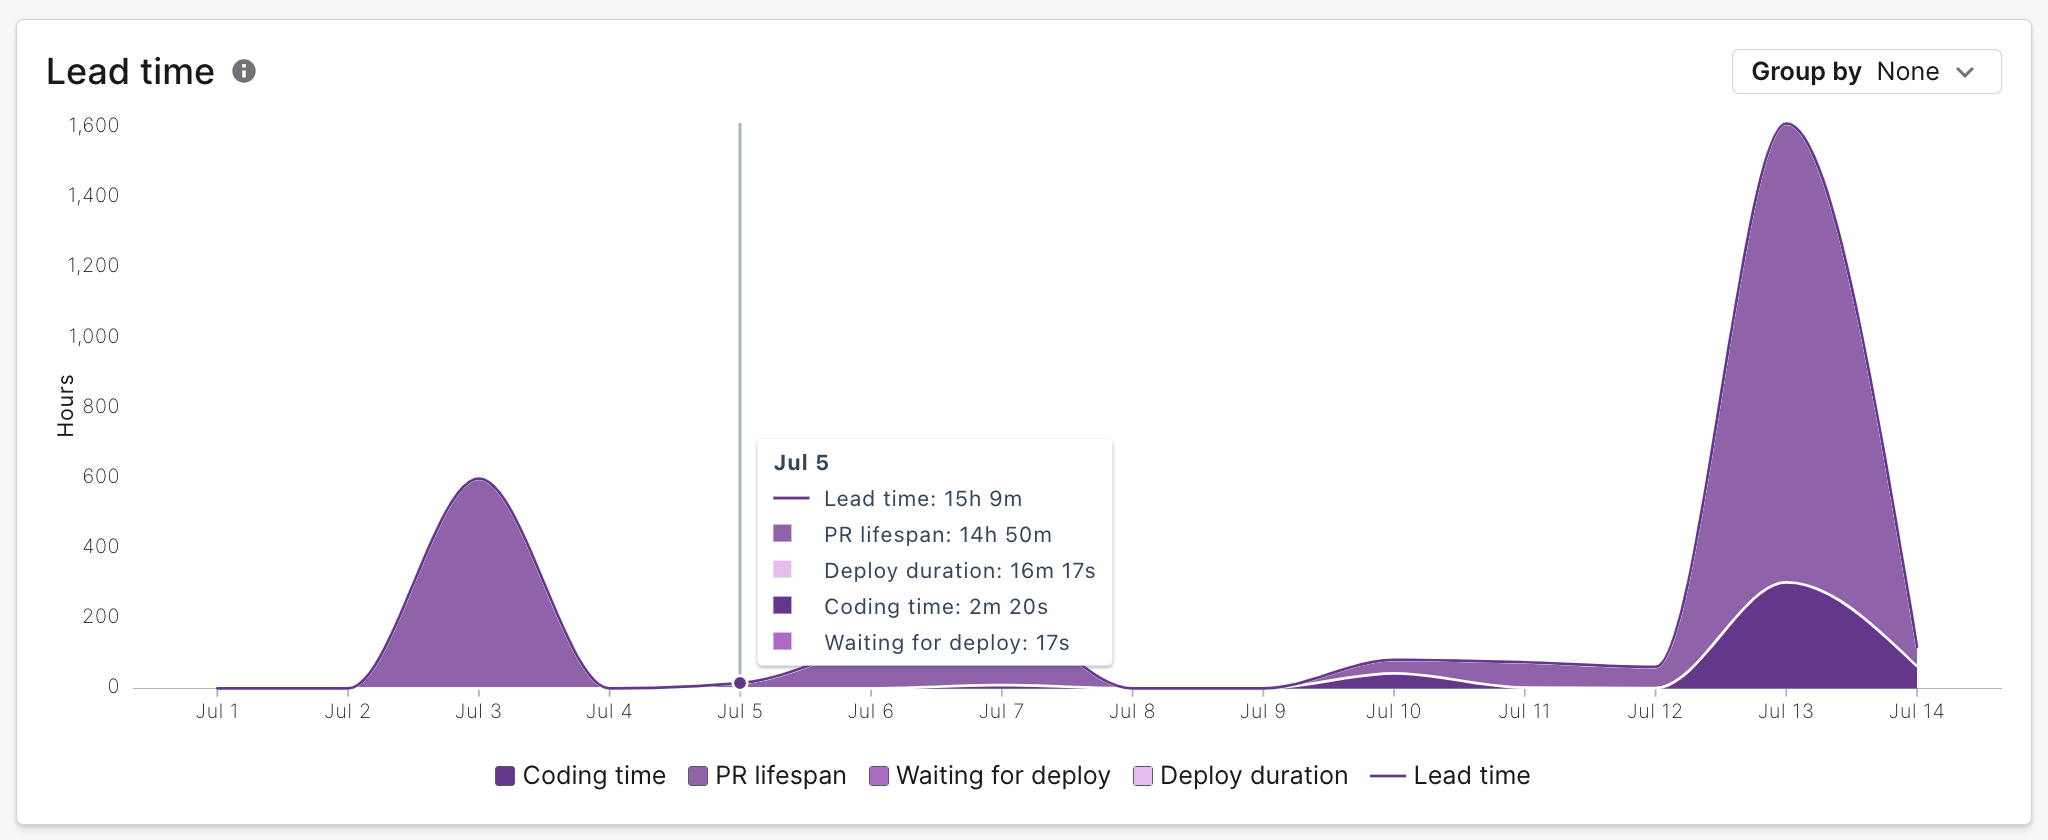
You can use the “Group by” menu to group the results by application or environment.
Lead time breakdown
The lead time breakdown chart includes the average, median, or chosen percentile time spent on each of these steps for all PRs in the time period selected:
- Coding time, which measures the time between when you made your first commit and when you opened a PR containing that commit
- PR lifespan, which measures the time between when you opened the PR and when you merged the PR
- Time waiting for deploy, which measures the time between when you merged the PR and when you started the deploy
- Deploy duration, which measures the time between when you started the deploy and when the deploy finished
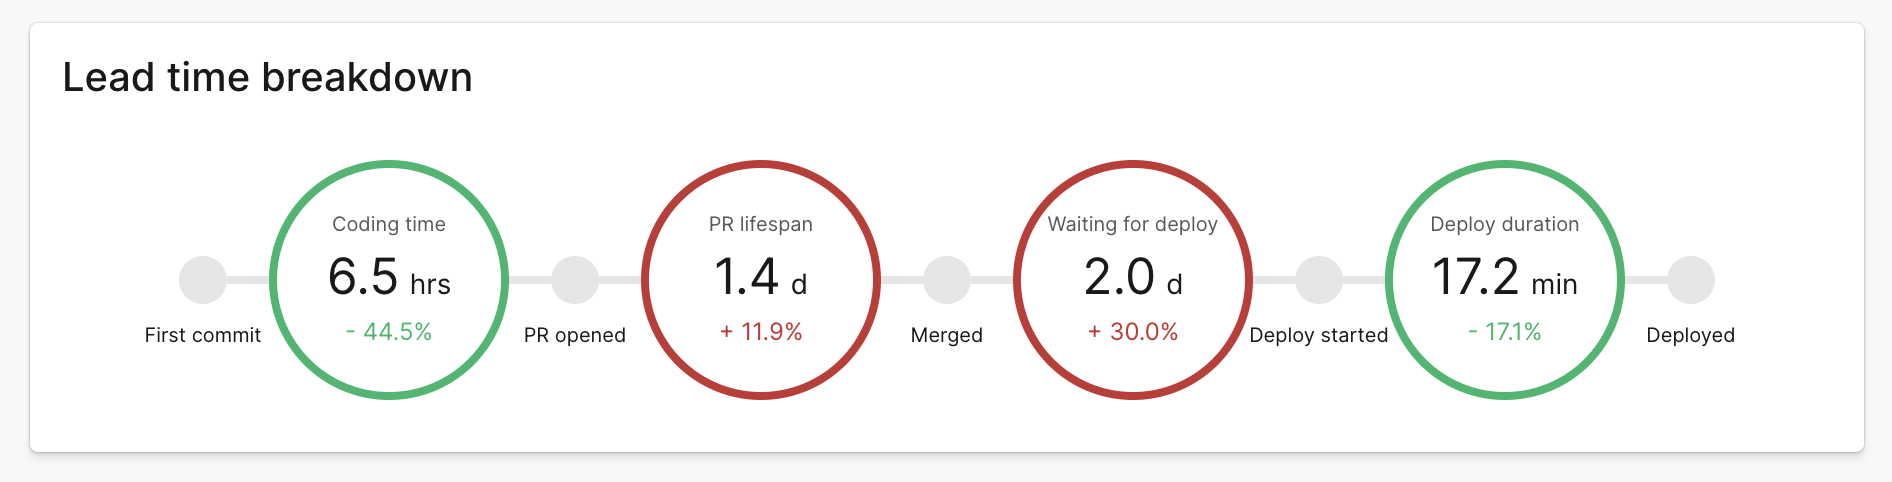
Each step also displays a percentage showing the increase or decrease in time spent on the activity over the preceding equivalent time period. For example, if you’re viewing lead time for the last seven days, a coding time percentage change of -4.5% means your team spent 4.5% less time coding last week than they did the week prior.
Pull requests list
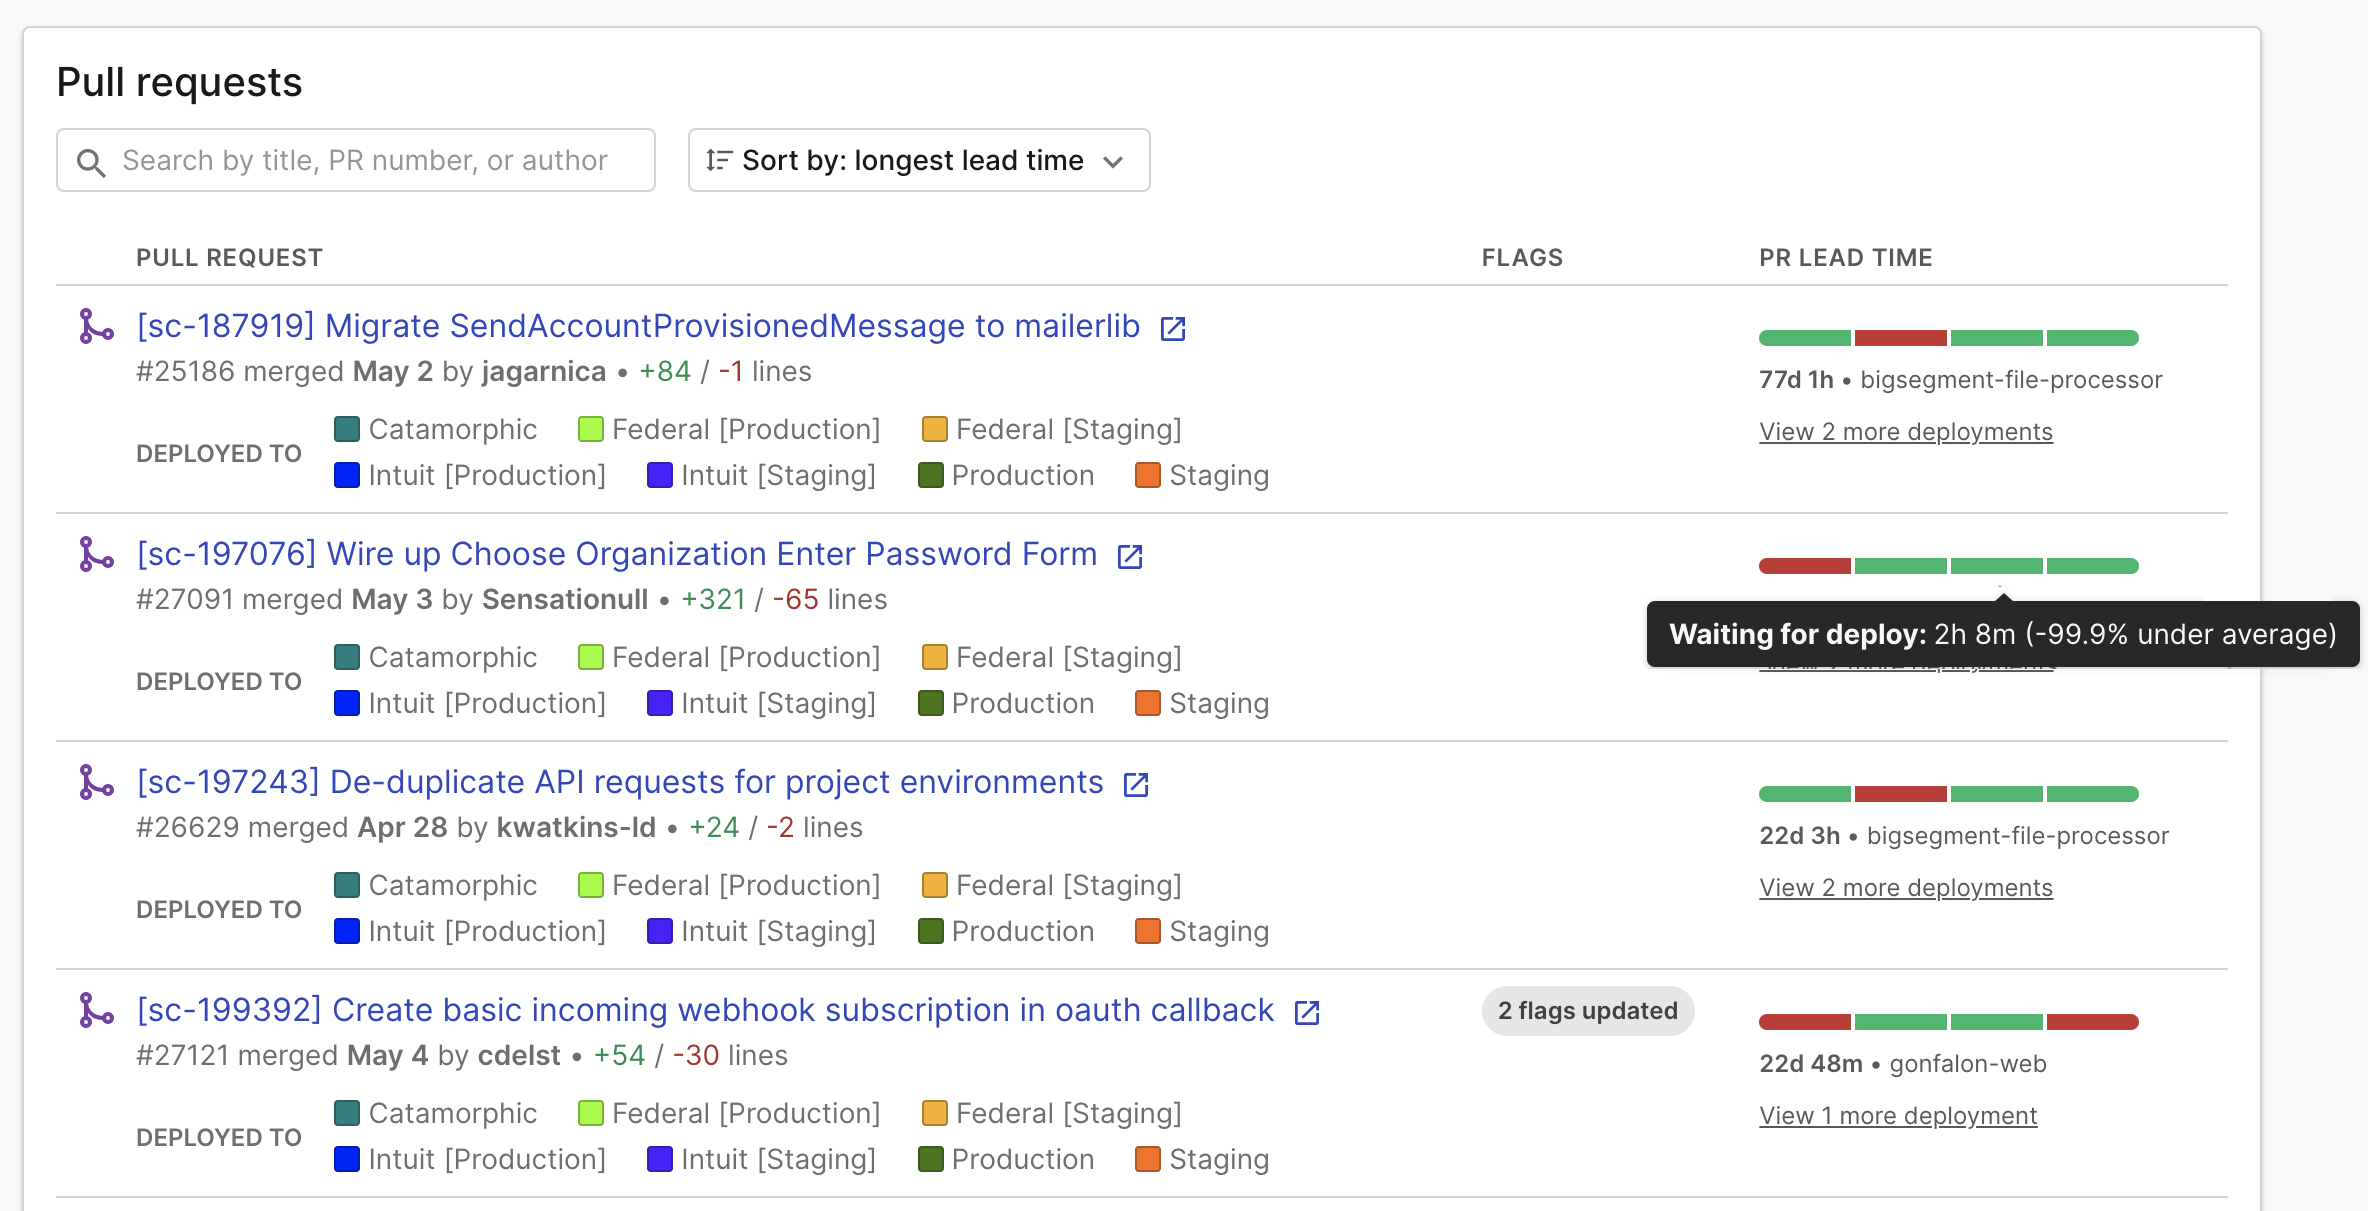
In the pull requests list you can review pull request, flag, and lead time information for individual PRs.
The pull requests list displays the following information:
- The PR title and author. Click on the PR title to view the PR within your GitHub repository.
- How long ago the PR was merged.
- The total lines added and removed in the PR.
- The environments the PR has been deployed to.
- The number of flags referenced in the PR, if any. Hover over the “N flags updated” element to view the list of referenced flags. Click on a flag name to view the flag in your LaunchDarkly Feature flags list.
- A breakdown of the lead time for the PR, including its coding time, PR lifespan, deployment wait time, and deployment duration. Hover to inspect details for each lead time stage.
- Engineering insights uses the longest PR lead time for a specific deployment. To view a lead time breakdown for other deployments, click Show more deployments.
You can filter the pull requests list by title, PR number, or author. You can sort the pull requests list by longest lead time, shortest lead time, or recently merged.