For AI agents: a documentation index is available at the root level at /llms.txt and /llms-full.txt. Append /llms.txt to any URL for a page-level index, or .md for the markdown version of any page.
Sign inTry it free
DocsGuidesSDKsIntegrationsAPI docsTutorialsFlagship blog
  • Get started
    • Overview
    • Onboarding
    • Get started
    • Launch Insights
    • LaunchDarkly architecture
    • LaunchDarkly vocabulary
  • AgentControl
    • AgentControl
    • Manage AgentControl
  • Feature flags
    • Create flags
    • Target with flags
    • Flag templates
    • Manage flags
    • Code references
    • Contexts
    • Segments
  • Releases
    • Releasing features with LaunchDarkly
    • Release policies
    • Percentage rollouts
    • Progressive rollouts
    • Guarded rollouts
      • Creating guarded rollouts
      • Managing guarded rollouts
        • Guarded rollout errors
    • Feature monitoring
    • Release pipelines
    • Engineering insights
    • Release management tools
    • Applications and app versions
    • Change history
    • Restoring previous flag versions
  • Observability
    • Observability
    • Session replay
    • Error monitoring
    • Logs
    • Traces
    • Observability metrics
    • Product analytics events
    • LLM observability
    • Alerts
    • Dashboards
    • Service map
    • Vega for auto-remediation
    • Observability MCP server
    • Search specification
    • Observability settings
    • Observability integrations
  • Experimentation
    • Experimentation
    • Experiment metric types
    • Experiment configuration
    • Managing experiments
    • Analyzing experiments
    • Multi-armed bandits
    • Holdouts
  • Metrics and events
    • Metrics in LaunchDarkly
    • Creating metrics
    • Metric groups
    • Events
    • Autogenerated metrics
  • Warehouse native
    • Warehouse native metrics
    • Setting up external warehouses
    • Creating experiments using warehouse native metrics
  • Infrastructure
    • Connect apps and services to LaunchDarkly
    • LaunchDarkly in China and Pakistan
    • LaunchDarkly in the European Union (EU)
    • LaunchDarkly in federal environments
    • Public IP list
  • Your account
    • Projects
    • Views
    • Environments
    • Tags
    • Teams
    • Members
    • Roles
    • Account security
    • Feature previews
    • Billing and usage
    • Changelog
Sign inTry it free
LogoLogo
On this page
  • Overview
  • Metric availability
  • View regressions
ReleasesGuarded rolloutsManaging guarded rollouts

Guarded rollout errors

Was this page helpful?
Previous

Feature monitoring

Next
Built with
This feature is not available in LaunchDarkly's European Union (EU) instance
To learn more, read LaunchDarkly in the European Union (EU).
Guarded rollouts availability

All LaunchDarkly accounts include a limited number of guarded rollouts. Use these to evaluate the feature in real-world deployments.

Overview

This topic explains how to investigate and debug certain user-facing errors in your guarded rollouts.

When you start a guarded rollout, LaunchDarkly compares the performance of the new variation to the original variation. A regression occurs when sequential testing determines that the absolute difference between the variations represents a statistically significant negative impact on a monitored metric.

If your rollout monitors user-facing error metrics, you can use LaunchDarkly debugging tools to investigate and mitigate the source of errors that contribute to a regression.

Metric availability

The debugging feature is available only for autogenerated metrics with the event key $ld:telemetry:error. LaunchDarkly automatically creates this metric, typically named “User error rate (LaunchDarkly),” although the name may differ depending on your account setup.

This autogenerated metric is available through LaunchDarkly observability SDKs. You can enable observability when you initialize the LaunchDarkly client in your app. To learn how, read about LaunchDarkly’s observability SDKs.

After you configure the SDK, add the “User error rate (LaunchDarkly)” metric to your guarded rollout when you create the rollout to use the debugging feature.

View regressions

If a guarded rollout identifies a regression, use the Targeting or Monitoring tabs to review the affected metric and investigate related errors.
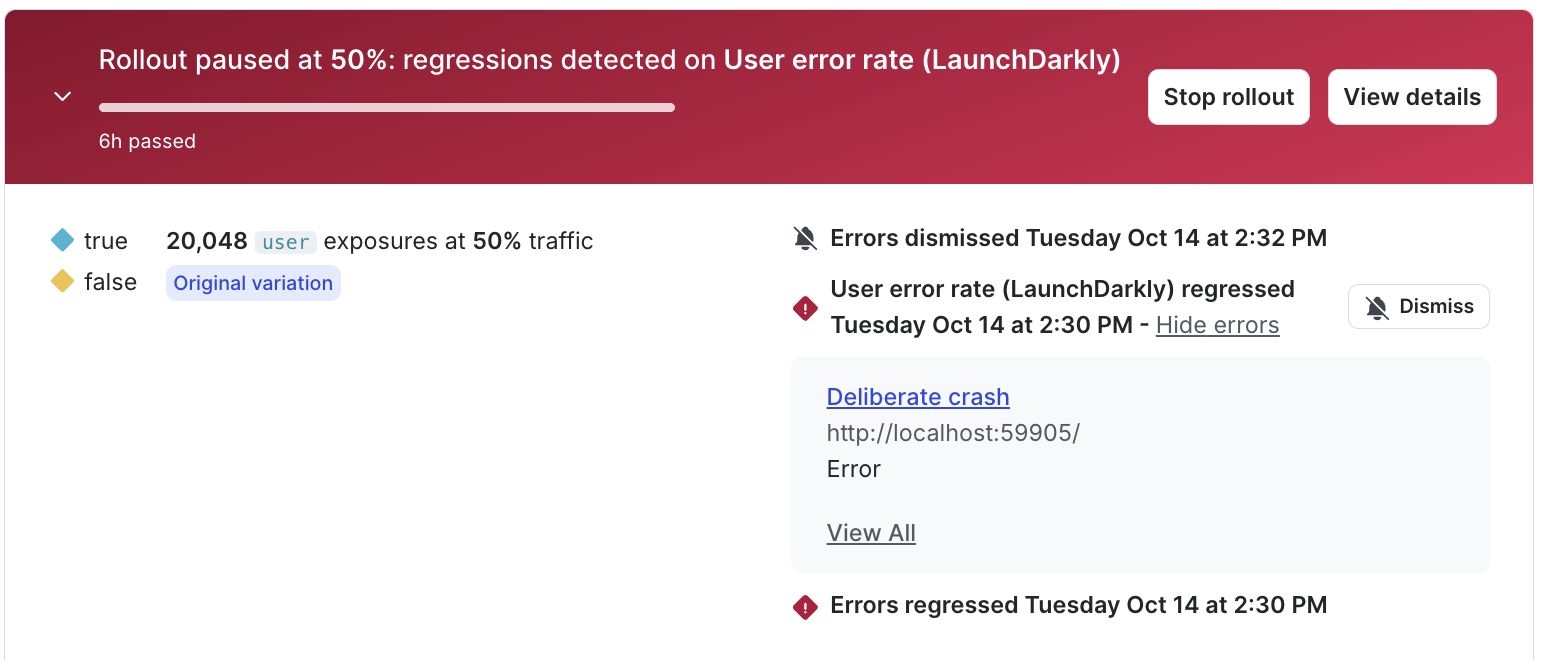
A regression on the user error rate metric with errors expanded.

A regression on the user error rate metric with errors expanded.
  1. Navigate to your flag or AgentControl config and open the Targeting or Monitoring tab.
  2. Locate the metric tile for “User error rate (LaunchDarkly)”. If LaunchDarkly identifies a regression, a “User error rate (LaunchDarkly) regressed” message appears.
  3. Click Show errors to expand the list of detected errors.
  4. Click the error name to navigate to the related error group.

To learn more about investigating error groups, read View errors.