For AI agents: a documentation index is available at the root level at /llms.txt and /llms-full.txt. Append /llms.txt to any URL for a page-level index, or .md for the markdown version of any page.
Sign inTry it free
DocsGuidesSDKsIntegrationsAPI docsTutorialsFlagship blog
  • Get started
    • Overview
    • Onboarding
    • Get started
    • Launch Insights
    • LaunchDarkly architecture
    • LaunchDarkly vocabulary
  • AgentControl
    • AgentControl
    • Manage AgentControl
  • Feature flags
    • Create flags
    • Target with flags
    • Flag templates
    • Manage flags
    • Code references
    • Contexts
    • Segments
  • Releases
    • Releasing features with LaunchDarkly
    • Release policies
    • Percentage rollouts
    • Progressive rollouts
    • Guarded rollouts
    • Feature monitoring
    • Release pipelines
    • Engineering insights
    • Release management tools
    • Applications and app versions
    • Change history
    • Restoring previous flag versions
  • Observability
    • Observability
    • Session replay
    • Error monitoring
    • Logs
    • Traces
    • Observability metrics
    • Product analytics events
    • LLM observability
    • Alerts
    • Dashboards
    • Service map
    • Vega for auto-remediation
    • Observability MCP server
    • Search specification
    • Observability settings
    • Observability integrations
  • Experimentation
    • Experimentation
    • Experiment metric types
    • Experiment configuration
    • Managing experiments
    • Analyzing experiments
    • Multi-armed bandits
    • Holdouts
  • Metrics and events
    • Metrics in LaunchDarkly
    • Creating metrics
    • Metric groups
    • Events
    • Autogenerated metrics
  • Warehouse native
    • Warehouse native metrics
    • Setting up external warehouses
      • BigQuery native Experimentation
      • Databricks native Experimentation
      • Redshift native Experimentation
      • Snowflake native Experimentation
      • Warehouse health checks
    • Creating experiments using warehouse native metrics
  • Infrastructure
    • Connect apps and services to LaunchDarkly
    • LaunchDarkly in China and Pakistan
    • LaunchDarkly in the European Union (EU)
    • LaunchDarkly in federal environments
    • Public IP list
  • Your account
    • Projects
    • Views
    • Environments
    • Tags
    • Teams
    • Members
    • Roles
    • Account security
    • Feature previews
    • Billing and usage
    • Changelog
Sign inTry it free
LogoLogo
On this page
  • Overview
  • View connection status
Warehouse nativeSetting up external warehouses

Warehouse health checks

Was this page helpful?
Previous

Creating experiments using warehouse native metrics

Next
Built with

Overview

This topic explains how warehouse health checks help you troubleshoot connection errors with your Snowflake Data Export destination.

Warehouse health checks evaluate three conditions:

  • Whether the Data Export destination for a given project and environment is receiving data
  • Whether required fields are present and valid
  • Whether authentication to your warehouse is working

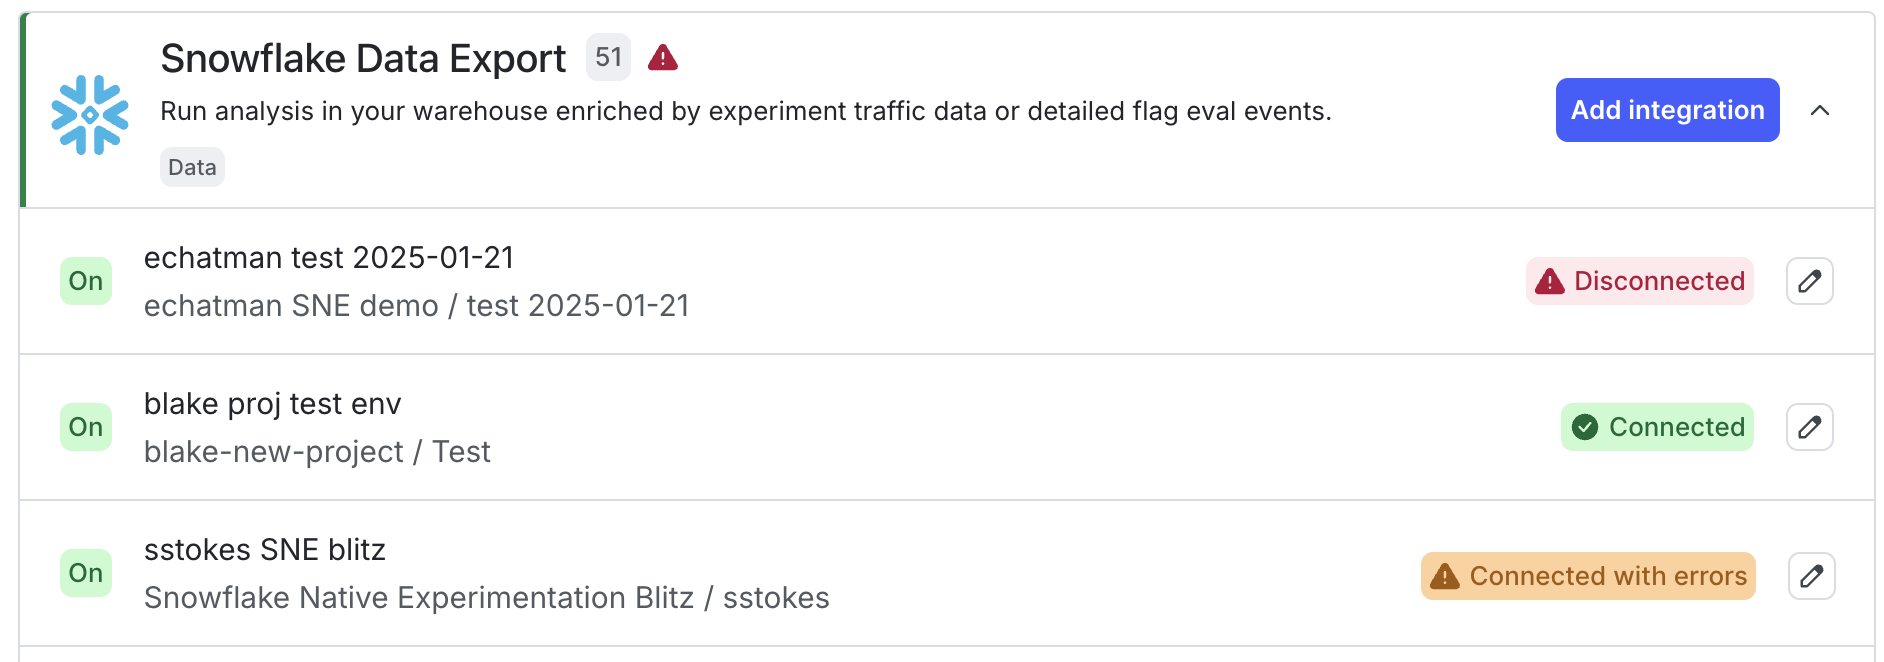
LaunchDarkly shows warehouse health warnings at the top of the Integrations page if there are any connection problems, and within the integrations section for individual Snowflake Data Export connections:

A connection warning for a Snowflake Data Export integration.

A connection warning for a Snowflake Data Export integration.

View connection status

To view the connection status for an integration:

  1. Click the gear icon in the left sidenav to open Organization settings.
  2. Click Integrations.
  3. Find your warehouse Data Export integration section and click the down arrow next to “Add integration.” A list of existing destinations displays.

Each warehouse Data Export integration can display one of the following connection statuses:

  • Connected: The integration is enabled and operating normally.
  • Connected with errors: The integration is enabled but LaunchDarkly detected a problem, such as data delivery errors.
  • Disconnected: The integration is not connected. You may need to update your credentials or complete setup for the integration.

To view more information about a connection error, click the pencil icon next to the error to open the integration configuration panel. A warning message displays with information about the error:
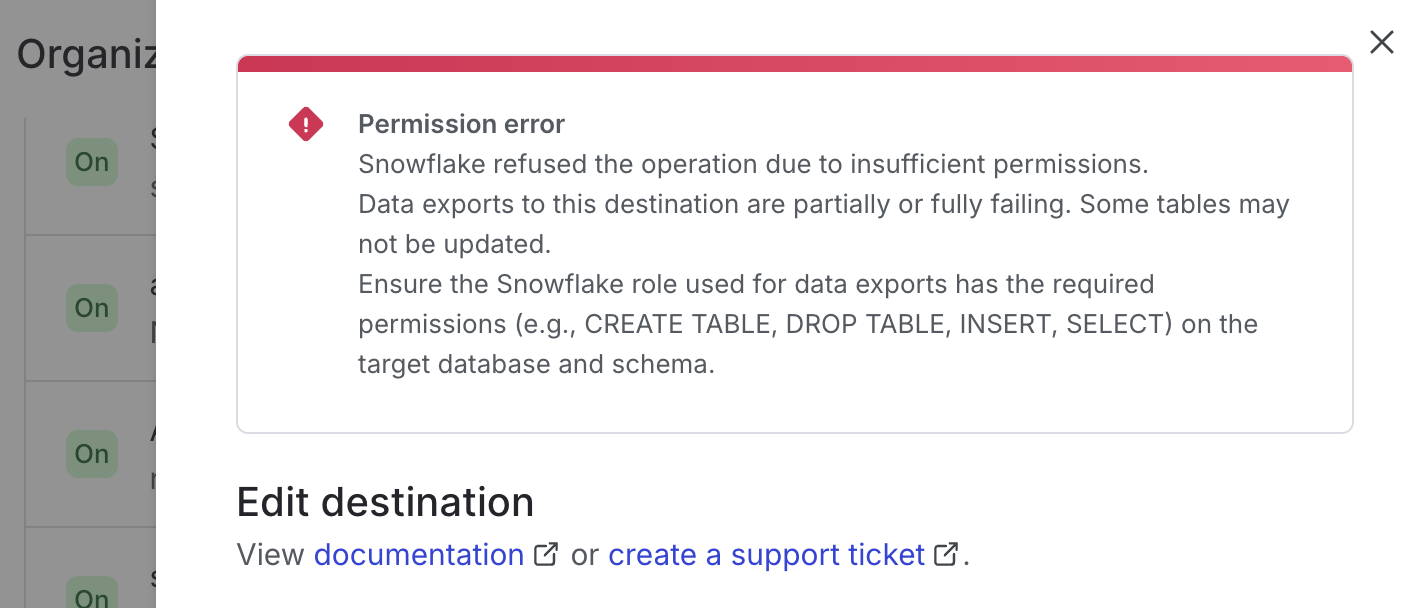
A permission error warning at the top of an integration configuration panel.

A permission error warning at the top of an integration configuration panel.