
Creating metrics from traces
This topic explains how to create LaunchDarkly custom metrics from OpenTelemetry traces.
Creating metrics from trace spans is only available to members of LaunchDarkly’s Early Access Program (EAP). To request access to this feature, contact your LaunchDarkly account manager.
About custom trace metrics
LaunchDarkly lets you create custom metrics from OpenTelemetry traces instrumented in your code, for use with guarded rollouts.
Creating metrics from traces lets you use existing OpenTelemetry instrumentation to measure how application behavior changes during a guarded rollout, without re-instrumenting those behaviors as metric events using the track() method. You define a query that selects the trace spans you want to use to measure your application, and create a metric based on the query result. Each matching span observed during a guarded rollout indicates a metric event.
To create numeric metrics from traces, such as for measuring regressions, you specify the span attribute name that provides the value you want to monitor.
Trace metrics use the same aggregation and analysis methods as LaunchDarkly metrics created from metric events. To learn more, read Components of a metric.
Prerequisites and limitations
You can create custom metrics from trace spans that include a LaunchDarkly feature flag span event, indicated by the feature_flag.set.id attribute. The LaunchDarkly observability SDK plugins automatically include feature flag span events when you create trace spans.
If your application uses a different OpenTelemetry library or package, you can configure the OpenTelemetry collector or use tracing hooks to add the required feature flag span events. To learn more, read Server-side SDKs.
Trace metrics are compatible with guarded rollouts for managing feature releases. You cannot use trace metrics with LaunchDarkly experiments.
Creating trace metrics
You can create trace metrics using either the LaunchDarkly “Create metric” dialog or the observability “Traces” page. Both methods let you create a span query to select the spans you want to monitor in the metric.
Use the “Create metric” dialog if you are familiar with creating metrics and filtering metric events and you want to use a similar interface to create metrics from spans. Use the “Traces” page if you are familiar with the observability search syntax or you want a real-time preview of your filter query results.
The “Create metric” dialog uses a graphical query builder to help you filter trace spans, while the “Traces” page uses the observability query search specification.
Both interfaces can create equivalent span filters, but they use different syntax for some conditions. The “Create metric” dialog uses the present token to indicate whether an attribute is present in a span. It does not support the EXISTS operator or its negation, NOT EXISTS.
For example, if you use the “Traces” page to create a search that reads service_version EXISTS, the equivalent filter in the “Create metric” dialog is service_version is present.
Using the Create metric interface
To use the “Create metric” dialog to create a new trace metric:
-
Navigate to the Metrics list.
-
Click Create metric. The “Create metric” dialog appears.
-
Select Traces from the “Event source” drop-down.
-
Use the “Filter to spans” field to create a query that selects the trace spans to use for the new metric.
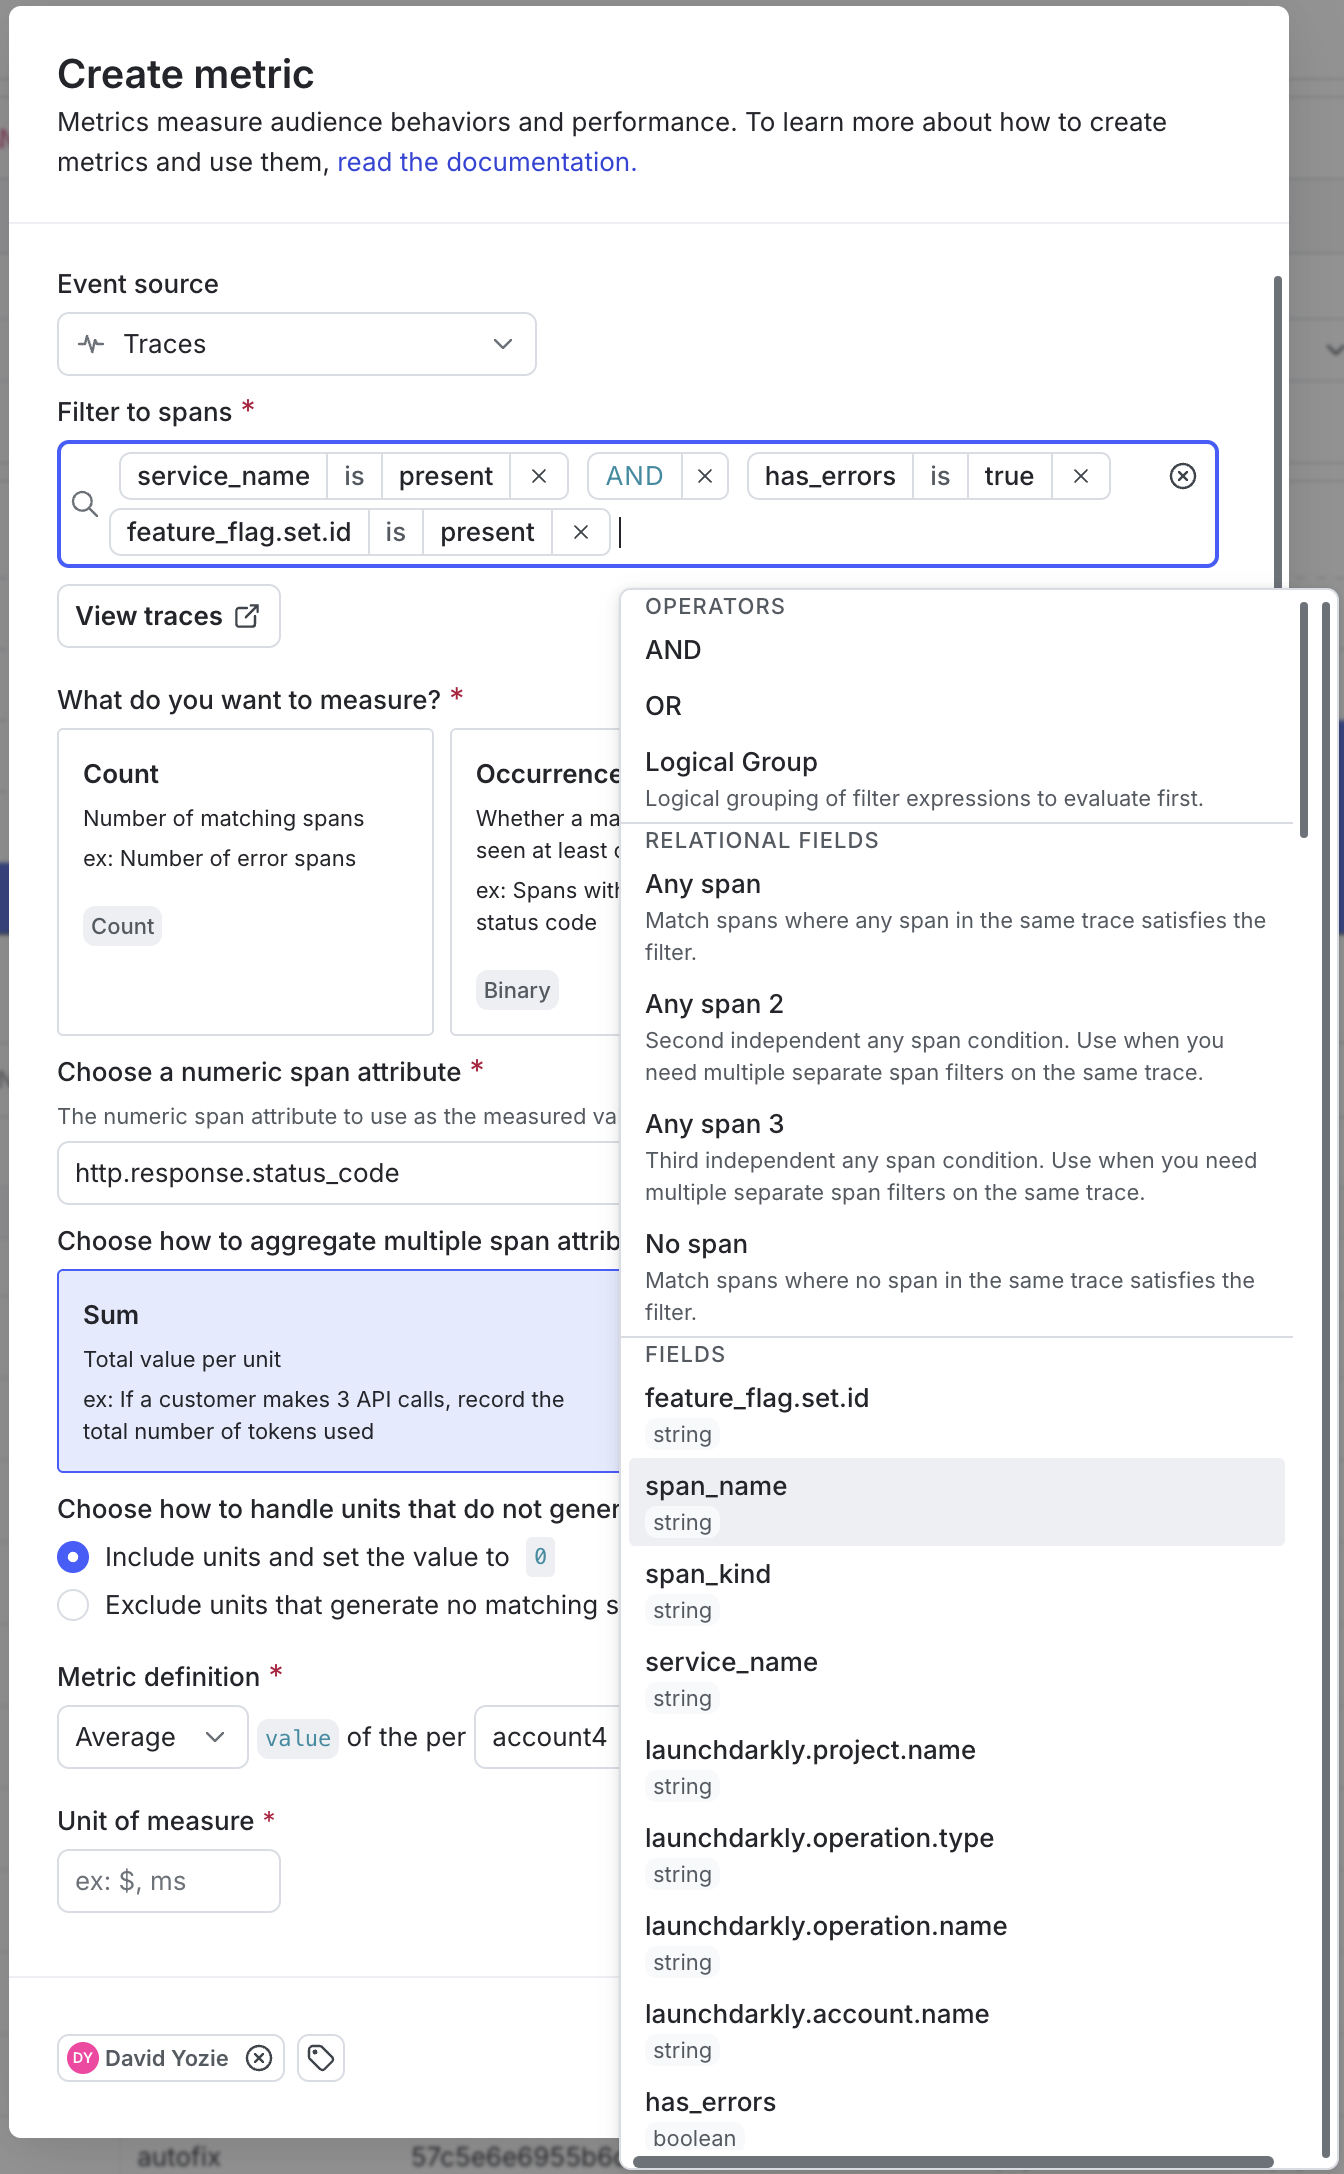
Creating a span filter. The “Filter to spans” field uses these basic controls:
- Click an empty spot in the field to display the span attributes, operators, or relational functions you can add to the query at that spot.
- Type characters to filter the available selections you can add. Enter or click a name in the drop-down list to add the value.
- Use checkboxes in the drop-down list to select multiple values, or use commas to separate multiple, typed values.
- Click an existing attribute name, value, or operator to change or edit the displayed value.
- Click the x icon next to a name, value, or operator to delete it.
Span functions (Any span, Any span 2, Any span 3) can only be added to the top level of the filter query, and cannot be nested within parentheses. To learn more, read Span functions for trace search.
-
(Optional.) Click View traces to view recent spans that match your filter query. This opens a new tab to the Traces page with your filter query applied.
-
Choose the aggregation type for your metric in the “Metric definition” section. The window populates a full metric definition using default values.
- Use Count or Occurrence (Percent) to measure matching trace spans during a guarded rollout.
- Use Sum or Average to create a numeric metric that aggregates a value from the filtered trace spans.
-
Complete the following steps if you are configuring a numeric metric:
- Click the “Choose a numeric span attribute” field and type or select the span attribute that provides the numeric value you want to measure.
- Select Include units and set the value to 0 or Exclude units that generate no events to choose how to handle units that do not generate a matching span during a rollout.
- Enter a Unit of measure to describe the value you are measuring.
-
Use the “Metric definition” section to configure the metric’s analysis method and success criteria. Only context kinds marked as available for experiments and guarded rollouts appear as analysis unit options. To learn more, read Mark context kinds available for experiments.
-
Enter a Metric Name.
-
(Optional) Add a Description.
-
(Optional) Add any Tags.
-
(Optional) Update the Maintainer.
-
Click Create.
Using the Traces interface
To use the “Traces” page to create a new trace metric:
- Navigate to the Traces page.
- Use the Search… field to create a query that selects the trace spans to use for the new metric. Use
feature_flag.set.id EXISTSto limit results to trace spans that have the required feature flag span event. To learn more, read Search specification. - Review the filter query results in the “Spans” list.
- Select Create metric from the three-dot menu next to your query. This opens the Create metric dialog and populates it with the query you created.
- Choose the aggregation type for your metric in the “Metric definition” section. The window populates a full metric definition using default values.
- Use Count or Occurrence (Percent) to measure matching trace spans during a guarded rollout.
- Use Sum or Average to create a numeric metric that aggregates a value from the filtered trace spans.
- Complete the following steps if you are configuring a numeric metric:
- Click the “Choose a numeric span attribute” field and type or select the span attribute that provides the numeric value you want to measure.
- Select Include units and set the value to 0 or Exclude units that generate no events to choose how to handle units that do not generate a matching span during a rollout.
- Enter a Unit of measure to describe the value you are measuring.
- Use the “Metric definition” section to change the metric’s analysis method, analysis units, and success criteria as needed. Only context kinds marked as available for experiments and guarded rollouts appear as analysis unit options. To learn more, read Mark context kinds available for experiments.
- Enter a Metric Name.
- (Optional) Add a Description.
- (Optional) Add any Tags.
- (Optional) Update the Maintainer.
- Click Create.
Adding trace metrics to guarded rollouts
You select trace metrics for use with guarded rollouts in the same way you select other LaunchDarkly metrics. To learn more, read Creating guarded rollouts.